Ubisoft 2006 Annual Report Download - page 105
Download and view the complete annual report
Please find page 105 of the 2006 Ubisoft annual report below. You can navigate through the pages in the report by either clicking on the pages listed below, or by using the keyword search tool below to find specific information within the annual report.-
 1
1 -
2
-
3
-
4
-
5
-
6
-
7
-
8
-
9
-
10
-
11
-
12
-
13
-
14
-
15
-
16
-
17
-
18
-
19
-
20
-
21
-
22
-
23
-
24
-
25
-
26
-
27
-
28
-
29
-
30
-
31
-
32
-
33
-
34
-
35
-
36
-
37
-
38
-
39
-
40
-
41
-
42
-
43
-
44
-
45
-
46
-
47
-
48
-
49
-
50
-
51
-
52
-
53
-
54
-
55
-
56
-
57
-
58
-
59
-
60
-
61
-
62
-
63
-
64
-
65
-
66
-
67
-
68
-
69
-
70
-
71
-
72
-
73
-
74
-
75
-
76
-
77
-
78
-
79
-
80
-
81
-
82
-
83
-
84
-
85
-
86
-
87
-
88
-
89
-
90
-
91
-
92
-
93
-
94
-
 95
95 -
 96
96 -
 97
97 -
 98
98 -
 99
99 -
 100
100 -
 101
101 -
 102
102 -
 103
103 -
 104
104 -
 105
105 -
 106
106 -
 107
107 -
 108
108 -
 109
109 -
 110
110 -
 111
111 -
 112
112 -
 113
113 -
 114
114 -
 115
115 -
116
-
117
-
118
-
119
-
120
-
121
-
122
-
123
-
124
-
125
-
126
-
127
-
128
-
129
-
130
-
131
-
132
-
133
-
134
-
135
-
136
-
137
-
138
-
139
-
140
-
141
-
142
-
143
-
144
-
145
-
146
-
147
-
148
-
149
-
150
-
151
-
152
-
153
-
154
-
155
-
156
-
157
-
158
-
159
-
160
-
161
-
162
-
163
-
164
-
165
-
166
-
167
-
168
-
169
-
170
-
171
-
172
-
173
-
174
-
175
-
176
-
177
-
178
-
179
-
180
-
181
-
182
-
183
-
184
-
185
-
186
-
187
-
188
-
189
 |
 |

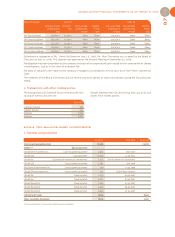
CORPORATE ACCOUNTS OF UBISOFT ENTERTAINMENT SA AS OF MARCH 31, 2007
93
3
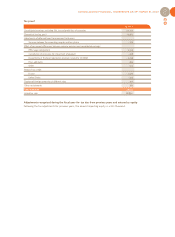
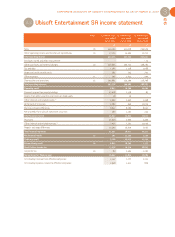
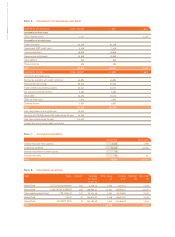
Ubisoft Entertainment SA income statement
3.2
Notes 12-month fiscal 12-month fiscal 12-month fiscal
year ended year ended year ended
03/31/2007 03/31/2006 03/31/2005
€K €K €K
Sales 18 435,190 314,228 294,529
Other operating income and transfers of expenditures 19 17,223 13,495 12,712
Total operating income 452,413 327,723 307,241
Purchases stored and other procurement - - - 25
Other purchases and external charges 20 240,601 206,725 168,285
Tax and duty 1,163 1,118 2,088
Wages and social security costs 761 745 741
Other expenses 21 192 2,632 294
Depreciation and provisions 22 200,861 133,269 116,798
Total operating expenses 443,578 344,489 288,181
Operating result 8,835 - 16,766 19,060
Financial income from equity holdings 25,618 1,338 81
Income from other securities and claims on fixed assets 18 16 -
Other interest and related income (1) 3,992 2,550 1,348
Write-back of provisions 2,782 639 12,024
Positive exchange differences 8,842 8,089 8,910
Net proceeds from sales of investment securities 380 1,192 254
Total financial income 41,632 13,824 22,617
Provisions 23,019 2,906 2,396
Other interest and related expenses (2) 7,923 7,551 11,026
Negativ exchange differences 10,399 15,620 7,055
Total financial expenses 41,341 26,077 20,477
Net financial result 23 291 - 12,253 2,140
Ordinary result 9,126 - 29,019 21,200
Extraordinary result 24 6,832 18,509 - 2,375
Result before income tax 15,958 - 10,510 18,825
Corporate tax 25 - 89 2,303 - 1,260
Net earnings for financial year 16,047 - 12,813 20,085
(1) including revenue from affiliated companies: 3,147 1,777 1,121
(2) including expenses related to affiliated companies: 2,658 1,511 806