Ubisoft 2006 Annual Report Download - page 80
Download and view the complete annual report
Please find page 80 of the 2006 Ubisoft annual report below. You can navigate through the pages in the report by either clicking on the pages listed below, or by using the keyword search tool below to find specific information within the annual report.-
 1
1 -
2
-
3
-
4
-
5
-
6
-
7
-
8
-
9
-
10
-
11
-
12
-
13
-
14
-
15
-
16
-
17
-
18
-
19
-
20
-
21
-
22
-
23
-
24
-
25
-
26
-
27
-
28
-
29
-
30
-
31
-
32
-
33
-
34
-
35
-
36
-
37
-
38
-
39
-
40
-
41
-
42
-
43
-
44
-
45
-
46
-
47
-
48
-
49
-
50
-
51
-
52
-
53
-
54
-
55
-
56
-
57
-
58
-
59
-
60
-
61
-
62
-
63
-
64
-
65
-
66
-
67
-
68
-
69
-
 70
70 -
 71
71 -
 72
72 -
 73
73 -
 74
74 -
 75
75 -
 76
76 -
 77
77 -
 78
78 -
 79
79 -
 80
80 -
 81
81 -
 82
82 -
 83
83 -
 84
84 -
 85
85 -
 86
86 -
 87
87 -
 88
88 -
 89
89 -
 90
90 -
91
-
92
-
93
-
94
-
95
-
96
-
97
-
98
-
99
-
100
-
101
-
102
-
103
-
104
-
105
-
106
-
107
-
108
-
109
-
110
-
111
-
112
-
113
-
114
-
115
-
116
-
117
-
118
-
119
-
120
-
121
-
122
-
123
-
124
-
125
-
126
-
127
-
128
-
129
-
130
-
131
-
132
-
133
-
134
-
135
-
136
-
137
-
138
-
139
-
140
-
141
-
142
-
143
-
144
-
145
-
146
-
147
-
148
-
149
-
150
-
151
-
152
-
153
-
154
-
155
-
156
-
157
-
158
-
159
-
160
-
161
-
162
-
163
-
164
-
165
-
166
-
167
-
168
-
169
-
170
-
171
-
172
-
173
-
174
-
175
-
176
-
177
-
178
-
179
-
180
-
181
-
182
-
183
-
184
-
185
-
186
-
187
-
188
-
189
 |
 |
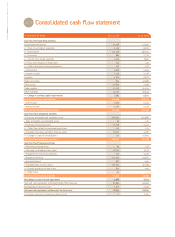
UBISOFT • FINANCIAL REPORT 2007
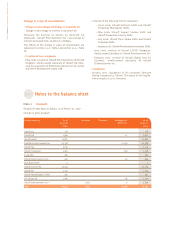
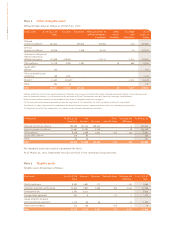
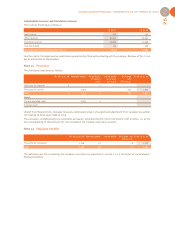
Note 2 Other intangible assets
Software breaks down as follows as of March 31, 2007:
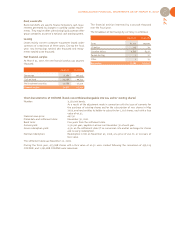
Note 3 Tangible assets
Tangible assets break down as follows:
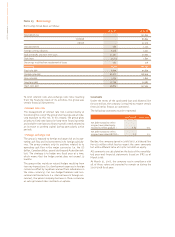
No intangible assets were used as a guarantee for debts.
As of March 31, 2007, impairment tests did not result in the recording of any provisions.
Software production costs of €161,196 thousand consist therefore of an increase of €164,913 thousand in released commercial software, minus €184 thousand in
external commercial software, €3,118 thousand for the acquisition of Driver®developments and €415 thousand in exchange rate differences.
Reclassifications between accounts are attributable to the transfer of intangible fixed assets in progress.
(1) This entry primarily includes brands obtained from the acquisition of TLC (€8 million), Far Cry®(€9 million) and Driver®(€14 million).
As of March 31, 2007, impairment tests conducted on the brands held by the group’s companies did not result in the recording of any provisions.
(2) Acquisition of the Far Cry®trademark for €7.5 million and the Driver®trademark for €14 million.
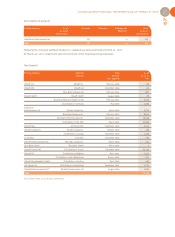
Fixed assets As of 03.31.06 Increases Decreases Reclassifications of Other Exchange As of
Gross software programs reclas- rate 03.31.07
in progress sifications differences Gross
Released
commercial software 252,034 - 198,916 160,993 - - 119 213,992
External
commercial software 90,076 - 2,226 54,124 - - 19 141,955
Commercial software and
external commercial
software in progress 115,926 226,009 - - 215,117 - - 1,215 125,603
Office software 12,758 2,085 1,083 - 38 - 408 13,390
Leased office
software 355 - - - - - 355
Others intangible assets
in progress 768 2,007 - - - - 2,775
Brands (1) 11,307 21,532(2) - - - - 1,411 31,428
Other 403 14 - - - - 417
Total 483,627 251,647 202,225 - 38 - 3,172 529,915
Amortization As of 03.31.06 Net Other Exchange rate As of 03.31.07
Cumulative Increases Decreases reclassifications differences
Released commercial software 189,680 162,214 198,916 - - 5 152,973
External commercial software 53,467 52,285 2,226 - - 18 103,508
Office software 6,156 4,368 1,042 - 337 - 243 8,902
Leased office software 270 85 - - - 355
Other 95 56 - - - 151
Total 249,668 219,008 202,184 - 337 - 266 265,889
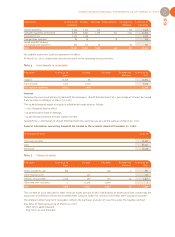
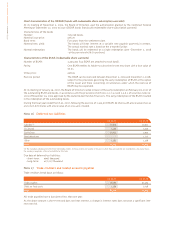
Fixed assets As of 03.31.06 Increases Decreases Reclassifications Exchange rate As of 03.31.07
Gross differences Gross
Plant & machinery 8,581 1,685 275 - - 422 9,569
Computer equipment and furniture 22,652 7,861 1,960 185 - 1,533 27,205
Development kits 2,764 6,171 - - - 8,935
Transportation equipment 247 9 - - 27 2 231
Leased computer hardware
and transportation equipment 1,112 60 26 - - 70 1,076
Fixed assets in progress 101 146 - - 225 2 24
Total 35,457 15,932 2,261 - 67 - 2,021 47,040