Ubisoft 2006 Annual Report Download - page 13
Download and view the complete annual report
Please find page 13 of the 2006 Ubisoft annual report below. You can navigate through the pages in the report by either clicking on the pages listed below, or by using the keyword search tool below to find specific information within the annual report.-
 1
1 -
2
-
 3
3 -
 4
4 -
 5
5 -
 6
6 -
 7
7 -
 8
8 -
 9
9 -
 10
10 -
 11
11 -
 12
12 -
 13
13 -
 14
14 -
 15
15 -
 16
16 -
 17
17 -
 18
18 -
 19
19 -
 20
20 -
 21
21 -
 22
22 -
 23
23 -
24
-
25
-
26
-
27
-
28
-
29
-
30
-
31
-
32
-
33
-
34
-
35
-
36
-
37
-
38
-
39
-
40
-
41
-
42
-
43
-
44
-
45
-
46
-
47
-
48
-
49
-
50
-
51
-
52
-
53
-
54
-
55
-
56
-
57
-
58
-
59
-
60
-
61
-
62
-
63
-
64
-
65
-
66
-
67
-
68
-
69
-
70
-
71
-
72
-
73
-
74
-
75
-
76
-
77
-
78
-
79
-
80
-
81
-
82
-
83
-
84
-
85
-
86
-
87
-
88
-
89
-
90
-
91
-
92
-
93
-
94
-
95
-
96
-
97
-
98
-
99
-
100
-
101
-
102
-
103
-
104
-
105
-
106
-
107
-
108
-
109
-
110
-
111
-
112
-
113
-
114
-
115
-
116
-
117
-
118
-
119
-
120
-
121
-
122
-
123
-
124
-
125
-
126
-
127
-
128
-
129
-
130
-
131
-
132
-
133
-
134
-
135
-
136
-
137
-
138
-
139
-
140
-
141
-
142
-
143
-
144
-
145
-
146
-
147
-
148
-
149
-
150
-
151
-
152
-
153
-
154
-
155
-
156
-
157
-
158
-
159
-
160
-
161
-
162
-
163
-
164
-
165
-
166
-
167
-
168
-
169
-
170
-
171
-
172
-
173
-
174
-
175
-
176
-
177
-
178
-
179
-
180
-
181
-
182
-
183
-
184
-
185
-
186
-
187
-
188
-
189
 |
 |

09
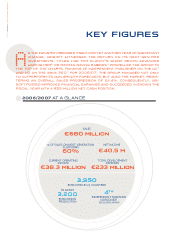
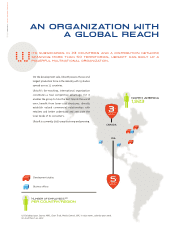
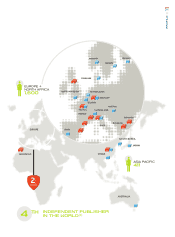
PROFILE
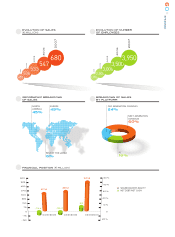
2003
2004
2005
2006
2007
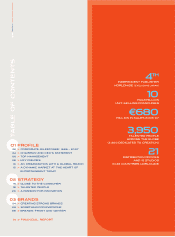
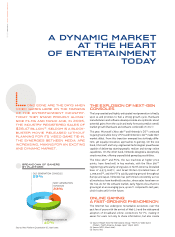
453
508
533547 680
2003
2004
2005
2006
2007
1,990
2,500
3,000
3,500
3,950
EVOLUTION OF NUMBER
OF EMPLOYEES
0
75
-75
03/31/2005 03/31/2006 03/31/2007
150
-150
225
300
375
450
525
600
50%
40%
30%
20%
10%
0
20%
-74,4
317,6
-65,3
381,3
521,8
55
SHAREHOLDER’S EQUITY
NET DEBT/NET CASH
OLD GENERATION CONSOLES
24%
NEXT-GENERATION
CONSOLES
60%
PC
16%
EVOLUTION OF SALES
(MILLION)
BREAKDOWN OF SALES
BY PLATFORM
GEOGRAPHIC BREAKDOWN
OF SALES
FINANCIAL POSITION (MILLION)
REST OF THE WORLD
6%
NORTH
AMERICA
45%
EUROPE
49%