Ubisoft 2006 Annual Report Download - page 107
Download and view the complete annual report
Please find page 107 of the 2006 Ubisoft annual report below. You can navigate through the pages in the report by either clicking on the pages listed below, or by using the keyword search tool below to find specific information within the annual report.-
 1
1 -
2
-
3
-
4
-
5
-
6
-
7
-
8
-
9
-
10
-
11
-
12
-
13
-
14
-
15
-
16
-
17
-
18
-
19
-
20
-
21
-
22
-
23
-
24
-
25
-
26
-
27
-
28
-
29
-
30
-
31
-
32
-
33
-
34
-
35
-
36
-
37
-
38
-
39
-
40
-
41
-
42
-
43
-
44
-
45
-
46
-
47
-
48
-
49
-
50
-
51
-
52
-
53
-
54
-
55
-
56
-
57
-
58
-
59
-
60
-
61
-
62
-
63
-
64
-
65
-
66
-
67
-
68
-
69
-
70
-
71
-
72
-
73
-
74
-
75
-
76
-
77
-
78
-
79
-
80
-
81
-
82
-
83
-
84
-
85
-
86
-
87
-
88
-
89
-
90
-
91
-
92
-
93
-
94
-
95
-
96
-
 97
97 -
 98
98 -
 99
99 -
 100
100 -
 101
101 -
 102
102 -
 103
103 -
 104
104 -
 105
105 -
 106
106 -
 107
107 -
 108
108 -
 109
109 -
 110
110 -
 111
111 -
 112
112 -
 113
113 -
 114
114 -
 115
115 -
 116
116 -
 117
117 -
118
-
119
-
120
-
121
-
122
-
123
-
124
-
125
-
126
-
127
-
128
-
129
-
130
-
131
-
132
-
133
-
134
-
135
-
136
-
137
-
138
-
139
-
140
-
141
-
142
-
143
-
144
-
145
-
146
-
147
-
148
-
149
-
150
-
151
-
152
-
153
-
154
-
155
-
156
-
157
-
158
-
159
-
160
-
161
-
162
-
163
-
164
-
165
-
166
-
167
-
168
-
169
-
170
-
171
-
172
-
173
-
174
-
175
-
176
-
177
-
178
-
179
-
180
-
181
-
182
-
183
-
184
-
185
-
186
-
187
-
188
-
189
 |
 |

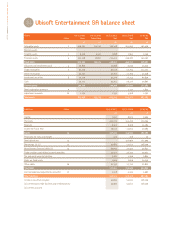
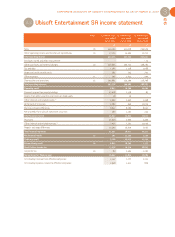
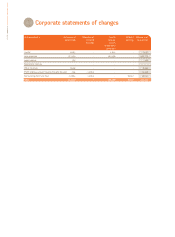
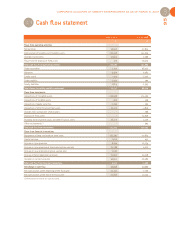
CORPORATE ACCOUNTS OF UBISOFT ENTERTAINMENT SA AS OF MARCH 31, 2007
95
3
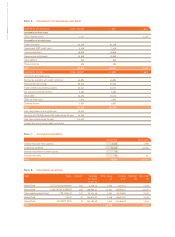
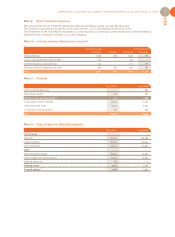
Cash flow statement
3.4
03/31/2007 03/31/2006
€K €K
Flows from operating activities
Net earnings 16,047 - 12,813
Depreciation of tangible and intangible assets 200,748 133,004
Changes in provisions 22,624 2,266
Flows from the disposal of fixed assets 170 - 18,473
Total cash flow from operating activities 239,589 103,984
Trade receivables - 7,744 68,477
Advances - 5,559 6,481
Sundry assets - 504 - 7,433
Trade payables - 2,253 290
Sundry liabilities 2,823 - 1,595
Total change in working capital requirement - 13,237 66,220
Flows from investments
Acquisitions of intangible assets - 209,048 - 173,194
Acquisitions of tangible assets - 406 - 146
Acquisition of equity securities - 1,739 - 294
Acquisition of other financial fixed assets - 26,226 - 4,816
Charges to be spread over several years - - 768
Disposal of fixed assets - 24,939
Proceeds from long-term loans and other financial assets 26,125 4,129
Other restatements (1) - - 593
Total cash flow from investments - 211,294 - 150,743
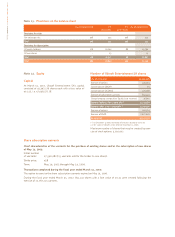
Flows from financial transactions
Repayment of long- and medium-term loans - 147,162 - 24,875
Capital increase 1,012 431
Increase in issue premium 8,594 12,174
Increase in issue premium of share subscription warrants 23,568 4,222
Increase in issue premium on group savings plan 1,557 -
Increase in bond redemption premium 71,637 24,228
Variation in current accounts 36,652 - 18,389
Total cash flow from financial transactions - 4,142 - 2,209
Net change in cash flow 10,916 17,252
Net cash position at the beginning of the fiscal year 10,143 - 7,109
Net cash position at the end of the fiscal year 21,059 10,143
(1) Restatement of brands for €593 thousand.