Ubisoft 2006 Annual Report Download - page 91
Download and view the complete annual report
Please find page 91 of the 2006 Ubisoft annual report below. You can navigate through the pages in the report by either clicking on the pages listed below, or by using the keyword search tool below to find specific information within the annual report.-
 1
1 -
2
-
3
-
4
-
5
-
6
-
7
-
8
-
9
-
10
-
11
-
12
-
13
-
14
-
15
-
16
-
17
-
18
-
19
-
20
-
21
-
22
-
23
-
24
-
25
-
26
-
27
-
28
-
29
-
30
-
31
-
32
-
33
-
34
-
35
-
36
-
37
-
38
-
39
-
40
-
41
-
42
-
43
-
44
-
45
-
46
-
47
-
48
-
49
-
50
-
51
-
52
-
53
-
54
-
55
-
56
-
57
-
58
-
59
-
60
-
61
-
62
-
63
-
64
-
65
-
66
-
67
-
68
-
69
-
70
-
71
-
72
-
73
-
74
-
75
-
76
-
77
-
78
-
79
-
80
-
 81
81 -
 82
82 -
 83
83 -
 84
84 -
 85
85 -
 86
86 -
 87
87 -
 88
88 -
 89
89 -
 90
90 -
 91
91 -
 92
92 -
 93
93 -
 94
94 -
 95
95 -
 96
96 -
 97
97 -
 98
98 -
 99
99 -
 100
100 -
 101
101 -
102
-
103
-
104
-
105
-
106
-
107
-
108
-
109
-
110
-
111
-
112
-
113
-
114
-
115
-
116
-
117
-
118
-
119
-
120
-
121
-
122
-
123
-
124
-
125
-
126
-
127
-
128
-
129
-
130
-
131
-
132
-
133
-
134
-
135
-
136
-
137
-
138
-
139
-
140
-
141
-
142
-
143
-
144
-
145
-
146
-
147
-
148
-
149
-
150
-
151
-
152
-
153
-
154
-
155
-
156
-
157
-
158
-
159
-
160
-
161
-
162
-
163
-
164
-
165
-
166
-
167
-
168
-
169
-
170
-
171
-
172
-
173
-
174
-
175
-
176
-
177
-
178
-
179
-
180
-
181
-
182
-
183
-
184
-
185
-
186
-
187
-
188
-
189
 |
 |
CONSOLIDATED FINANCIAL STATEMENTS AS OF MARCH 31, 2007
79
2
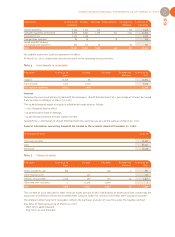
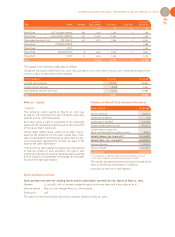
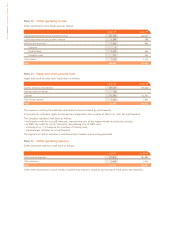
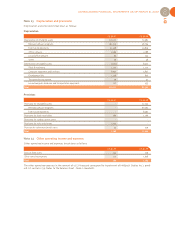
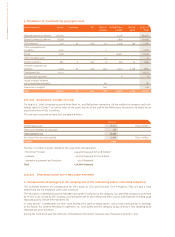
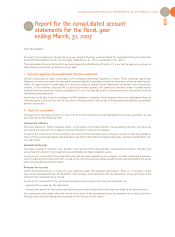
Note 18 Sundry creditors
Other debts breaks down as follows:
(1) Unearned income includes Canadian subsidies totaling €7.8 million, a €0.5 million incentive linked to a lease in Canada and prepaid sales in the amount of
€5 million.
Other debts have a due date of less than one year.
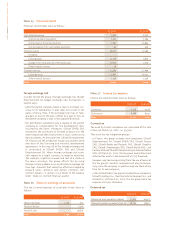
Notes to the income statement
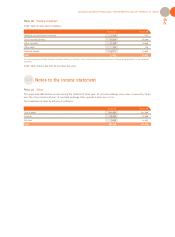
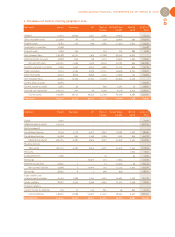
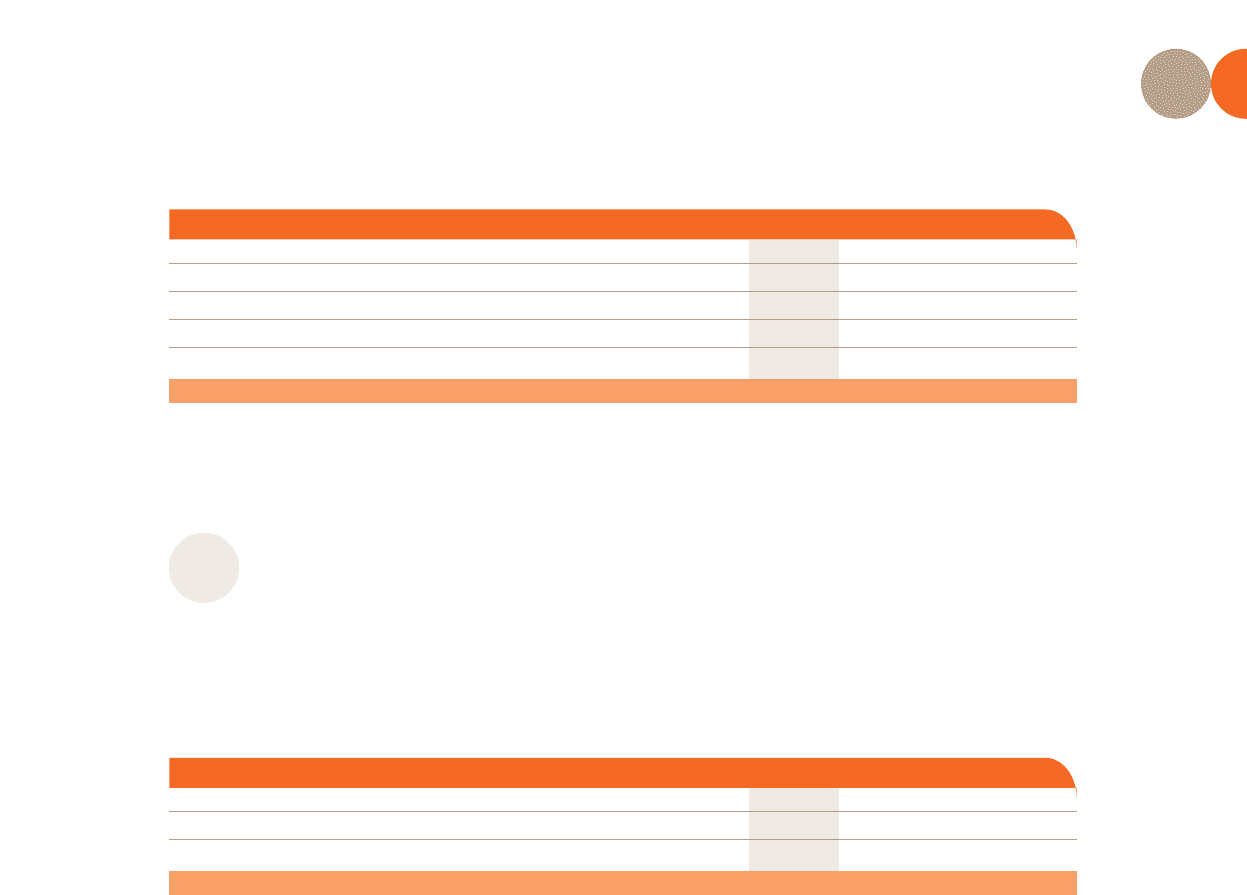
Note 19 Sales
The group had €680 million in sales during the 2006/2007 fiscal year. At current exchange rates, sales increased by 24.4%
over the 2005/2006 fiscal year; at constant exchange rates, growth in sales was 27.2%.
The breakdown of sales by activity is as follows:
2.5.5
03.31.07 03.31.06
Advances and installments received 1,734 122
Social security liabilities 27,320 18,199
Other tax debts 33,168 19,640
Other debts 162 120
Deferred income 13,511(1) 13,992
Total 75,895 52,073
03.31.07 03.31.06
Sale of goods 654,962 514,599
Licences 16,340 18,466
Services 9,046 14,005
Total 680,348 547,070