Ubisoft 2006 Annual Report Download - page 70
Download and view the complete annual report
Please find page 70 of the 2006 Ubisoft annual report below. You can navigate through the pages in the report by either clicking on the pages listed below, or by using the keyword search tool below to find specific information within the annual report.-
 1
1 -
2
-
3
-
4
-
5
-
6
-
7
-
8
-
9
-
10
-
11
-
12
-
13
-
14
-
15
-
16
-
17
-
18
-
19
-
20
-
21
-
22
-
23
-
24
-
25
-
26
-
27
-
28
-
29
-
30
-
31
-
32
-
33
-
34
-
35
-
36
-
37
-
38
-
39
-
40
-
41
-
42
-
43
-
44
-
45
-
46
-
47
-
48
-
49
-
50
-
51
-
52
-
53
-
54
-
55
-
56
-
57
-
58
-
59
-
 60
60 -
 61
61 -
 62
62 -
 63
63 -
 64
64 -
 65
65 -
 66
66 -
 67
67 -
 68
68 -
 69
69 -
 70
70 -
 71
71 -
 72
72 -
 73
73 -
 74
74 -
 75
75 -
 76
76 -
 77
77 -
 78
78 -
 79
79 -
 80
80 -
81
-
82
-
83
-
84
-
85
-
86
-
87
-
88
-
89
-
90
-
91
-
92
-
93
-
94
-
95
-
96
-
97
-
98
-
99
-
100
-
101
-
102
-
103
-
104
-
105
-
106
-
107
-
108
-
109
-
110
-
111
-
112
-
113
-
114
-
115
-
116
-
117
-
118
-
119
-
120
-
121
-
122
-
123
-
124
-
125
-
126
-
127
-
128
-
129
-
130
-
131
-
132
-
133
-
134
-
135
-
136
-
137
-
138
-
139
-
140
-
141
-
142
-
143
-
144
-
145
-
146
-
147
-
148
-
149
-
150
-
151
-
152
-
153
-
154
-
155
-
156
-
157
-
158
-
159
-
160
-
161
-
162
-
163
-
164
-
165
-
166
-
167
-
168
-
169
-
170
-
171
-
172
-
173
-
174
-
175
-
176
-
177
-
178
-
179
-
180
-
181
-
182
-
183
-
184
-
185
-
186
-
187
-
188
-
189
 |
 |
UBISOFT • FINANCIAL REPORT 2007
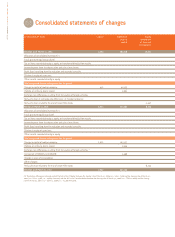
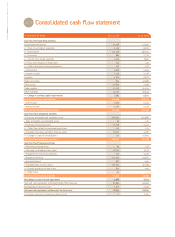
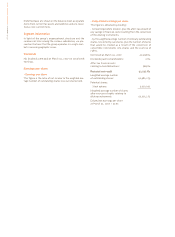
Consolidated cash flow statement
2.4
in thousands of euros 03.31.2007 03.31.2006
Cash flow from operating activities
Consolidated net income 40,558 11,932
+/- Share in earnings of associates -3,149 -19,109
+/- Depreciation 230,118 158,792
+/- Provisions 884 2,776
+/- Cost of share-based payments 3,344 2,692
+/- Flows from disposal of fixed assets 243 126
+/- Other calculated income and expenses -221 -147
+ interest paid 4,678 5,934
+ income tax paid 7,129 5,018
Inventory -1,914 -2,873
Trade receivables -842 54,688
Other assets -34,830 -7,048
Trade payables 11,539 -32,204
Other liabilities 33,429 -18,434
+/- Change in working capital requirement 7,382 -5,871
Cash flow from operating activities 290,966 162,143
- interest paid -4,678 -5,934
- income tax paid -7,129 -5,018
Net cash flow from operating activities 279,159 151,191
Cash flow from investment activities
- Purchases of tangible and intangible assets -269,402 -201,866
+ Sales of tangible and intangible assets 95 140
- Purchases of financial assets -15,778 -4,227
+/- Other flow related to investment operations -153 -153
+ Proceeds from loans and other financial assets 16,077 3,787
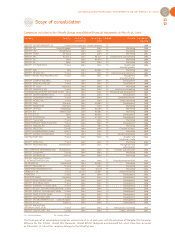
+/- Change in scope of consolidation (1) 170 22,691
Cash flow from investment activities (1) -268,991 -179,628
Cash flow from financing activities
+ New finance leasing loans 60 128
+ New long- and medium-term loans 30,740 7,537
- Repayment of finance leasing loans -230 -1,040
- Repayment of loans -151,933 -24,875
+ Accrued interest -807 -650
+ Proceeds from issue of capital 106,551 40,786
+/- Resales/purchases of own shares 625 -503
+/- Other flows -42 -
Cash flow from financing activities -15,036 21,383
Net change in cash and cash equivalents -4,868 -7,054
Cash and cash equivalents at the beginning of the fiscal year 80,894 90,493
Exchange gains/losses on cash 2,627 -2,545
Cash and cash equivalents at the end of the fiscal year 78,653 80,894
(1) Including cash position of companies purchased and sold -17 22,697