Ubisoft 2006 Annual Report Download - page 96
Download and view the complete annual report
Please find page 96 of the 2006 Ubisoft annual report below. You can navigate through the pages in the report by either clicking on the pages listed below, or by using the keyword search tool below to find specific information within the annual report.-
 1
1 -
2
-
3
-
4
-
5
-
6
-
7
-
8
-
9
-
10
-
11
-
12
-
13
-
14
-
15
-
16
-
17
-
18
-
19
-
20
-
21
-
22
-
23
-
24
-
25
-
26
-
27
-
28
-
29
-
30
-
31
-
32
-
33
-
34
-
35
-
36
-
37
-
38
-
39
-
40
-
41
-
42
-
43
-
44
-
45
-
46
-
47
-
48
-
49
-
50
-
51
-
52
-
53
-
54
-
55
-
56
-
57
-
58
-
59
-
60
-
61
-
62
-
63
-
64
-
65
-
66
-
67
-
68
-
69
-
70
-
71
-
72
-
73
-
74
-
75
-
76
-
77
-
78
-
79
-
80
-
81
-
82
-
83
-
84
-
85
-
 86
86 -
 87
87 -
 88
88 -
 89
89 -
 90
90 -
 91
91 -
 92
92 -
 93
93 -
 94
94 -
 95
95 -
 96
96 -
 97
97 -
 98
98 -
 99
99 -
 100
100 -
 101
101 -
 102
102 -
 103
103 -
 104
104 -
 105
105 -
 106
106 -
107
-
108
-
109
-
110
-
111
-
112
-
113
-
114
-
115
-
116
-
117
-
118
-
119
-
120
-
121
-
122
-
123
-
124
-
125
-
126
-
127
-
128
-
129
-
130
-
131
-
132
-
133
-
134
-
135
-
136
-
137
-
138
-
139
-
140
-
141
-
142
-
143
-
144
-
145
-
146
-
147
-
148
-
149
-
150
-
151
-
152
-
153
-
154
-
155
-
156
-
157
-
158
-
159
-
160
-
161
-
162
-
163
-
164
-
165
-
166
-
167
-
168
-
169
-
170
-
171
-
172
-
173
-
174
-
175
-
176
-
177
-
178
-
179
-
180
-
181
-
182
-
183
-
184
-
185
-
186
-
187
-
188
-
189
 |
 |

UBISOFT • FINANCIAL REPORT 2007
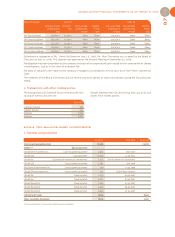
Appendix notes
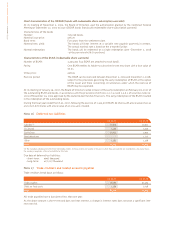
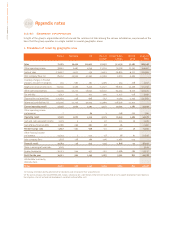
2.5.6.1 Segment information
In light of the group's organizational structure and the commercial links among the various subsidiaries, we proceed on the
basis that the group operates in a single market in several geographic areas.
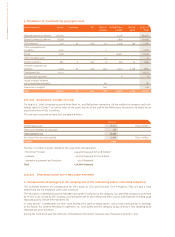
1. Breakdown of result by geographic area
(1) Invoicing of products purchased on behalf of subsidiaries and reinvoiced at their acquisition cost.
(2) The parent company, like Ubisoft EMEA SAS, invoices subsidiaries for a contribution in the form of royalties that serve to support development costs (deprecia-
tion of games, internal and external development, royalties) and head office costs.
2.5.6
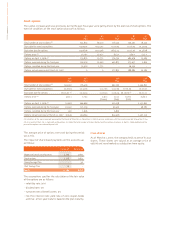
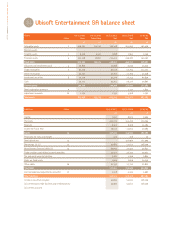
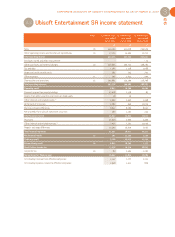
France Germany UK Rest of United States Rest of 03.31.07
Europe Canada world Total
Sales 71,183 56,426 110,452 97,052 313,150 32,085 680,348
Other operating income 58,622 2,467 4,239 11,116 74,518 15,505 166,467
Costs of sales -119,657 -3,611 -359 -9,421 -90,810 -6,111 -229,969
Inter-company flows (1) 85,252 -14,955 -37,442 -32,369 5,019 -5,505 -
Inventory changes in finished
products and work-in-progress 155 -590 261 1,499 434 278 2,037
Wages and social security costs -63,940 -4,566 -6,530 -14,577 -68,916 -12,509 -171,038
Other operating expenses -53,159 -12,227 -18,057 -18,207 -63,555 -9,070 -174,275
Tax and duty -3,727 -21 -312 -195 -1,577 -118 -5,950
Depreciation and provisions -220,959 -148 -608 -757 -9,164 -1,045 -232,681
Reinvoiced contributions (2) 263,546 -21,705 -49,443 -31,969 -148,506 -11,923 -
Current operating result 17,316 1,070 2,201 2,172 10,593 1,587 34,939
Other operating income
and expenses -7 - -86 3 -148 -122 -360
Operating result 17,309 1,070 2,115 2,175 10,445 1,465 34,579
Cash and cash-equivalent income 1,229 5 3 47 173 19 1,476
Cost of gross financial debts -6,086 -196 -661 -68 -56 - -7,067
Net borrowings costs -4,857 -191 -658 -21 117 19 -5,591
Other financial income
and expense 23,743 7 -223 -18 68 61 23,638
Inter-company flows 1,878 158 366 -206 -2,083 -113 -
Financial result 20,764 -26 -515 -245 -1,898 -33 18,047
Share in earnings of associates 3,149 - - - - - 3,149
Income tax expense -10,311 -144 -451 -745 -2,986 -580 -15,217
Profit for the year 30,911 900 1,149 1,185 5,561 852 40,558
Attributable to minority
interests share ---- ---
Group 30,911 900 1,149 1,185 5,561 852 40,558