Ubisoft 2006 Annual Report Download - page 66
Download and view the complete annual report
Please find page 66 of the 2006 Ubisoft annual report below. You can navigate through the pages in the report by either clicking on the pages listed below, or by using the keyword search tool below to find specific information within the annual report.-
 1
1 -
2
-
3
-
4
-
5
-
6
-
7
-
8
-
9
-
10
-
11
-
12
-
13
-
14
-
15
-
16
-
17
-
18
-
19
-
20
-
21
-
22
-
23
-
24
-
25
-
26
-
27
-
28
-
29
-
30
-
31
-
32
-
33
-
34
-
35
-
36
-
37
-
38
-
39
-
40
-
41
-
42
-
43
-
44
-
45
-
46
-
47
-
48
-
49
-
50
-
51
-
52
-
53
-
54
-
55
-
 56
56 -
 57
57 -
 58
58 -
 59
59 -
 60
60 -
 61
61 -
 62
62 -
 63
63 -
 64
64 -
 65
65 -
 66
66 -
 67
67 -
 68
68 -
 69
69 -
 70
70 -
 71
71 -
 72
72 -
 73
73 -
 74
74 -
 75
75 -
 76
76 -
77
-
78
-
79
-
80
-
81
-
82
-
83
-
84
-
85
-
86
-
87
-
88
-
89
-
90
-
91
-
92
-
93
-
94
-
95
-
96
-
97
-
98
-
99
-
100
-
101
-
102
-
103
-
104
-
105
-
106
-
107
-
108
-
109
-
110
-
111
-
112
-
113
-
114
-
115
-
116
-
117
-
118
-
119
-
120
-
121
-
122
-
123
-
124
-
125
-
126
-
127
-
128
-
129
-
130
-
131
-
132
-
133
-
134
-
135
-
136
-
137
-
138
-
139
-
140
-
141
-
142
-
143
-
144
-
145
-
146
-
147
-
148
-
149
-
150
-
151
-
152
-
153
-
154
-
155
-
156
-
157
-
158
-
159
-
160
-
161
-
162
-
163
-
164
-
165
-
166
-
167
-
168
-
169
-
170
-
171
-
172
-
173
-
174
-
175
-
176
-
177
-
178
-
179
-
180
-
181
-
182
-
183
-
184
-
185
-
186
-
187
-
188
-
189
 |
 |
UBISOFT • FINANCIAL REPORT 2007
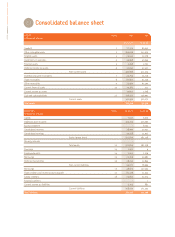
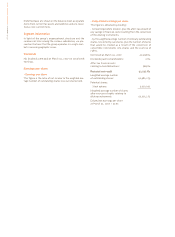
Consolidated balance sheet
2.1
ASSETS Notes Net Net
in thousands of euros
03.31.07 03.31.06
Goodwill 1 77,374 80,032
Other intangible assets 2 264,026 233,959
Tangible assets 3 25,510 22,276
Investments in associates 4 33,998 30,034
Financial assets 5 2,458 2,702
Deferred income tax assets 6 37,630 42,321
Non-current assets 440,996 411,324
Inventory and work-in-progress 7 24,794 23,716
Trade receivables 8 87,857 91,246
Other receivables 9 73,959 62,290
Current financial assets 10 19,183 321
Current income tax assets 10,605 5,708
Cash and cash equivalents 11 126,552 136,991
Current assets 342,950 320,272
Total assets 783,946 731,596
LIABILITIES Notes 03.31.07 03.31.06
in thousands of euros
Capital 7,037 6,025
Additional paid-in capital 435,234 325,065
Equity component - 8,204
Consolidated reserves 38,990 30,032
Consolidated earnings 40,558 11,932
Equity (group share) 521,819 381,258
Minority interests --
Total equity 12 521,819 381,258
Provisions 13 1,952 4
Employee benefits 14 1,205 1,156
Borrowings 15 22,706 54,981
Deferred tax liabilities 16 28,214 22,854
Non-current liabilities 54,077 78,995
Borrowings 15 48,874 147,354
Trade creditors and related accounts payable 17 81,178 71,033
Sundry creditors 18 75,895 52,073
Financial liabilities -1
Current income tax liabilities 2,103 882
Current liabilities 208,050 271,343
Total liabilities 783,946 731,596