TCF Bank 2015 Annual Report Download - page 9
Download and view the complete annual report
Please find page 9 of the 2015 TCF Bank annual report below. You can navigate through the pages in the report by either clicking on the pages listed below, or by using the keyword search tool below to find specific information within the annual report.-
 1
1 -
 2
2 -
 3
3 -
 4
4 -
 5
5 -
 6
6 -
 7
7 -
 8
8 -
 9
9 -
 10
10 -
 11
11 -
 12
12 -
 13
13 -
 14
14 -
 15
15 -
 16
16 -
 17
17 -
 18
18 -
 19
19 -
 20
20 -
21
-
22
-
23
-
24
-
25
-
26
-
27
-
28
-
29
-
30
-
31
-
32
-
33
-
34
-
35
-
36
-
37
-
38
-
39
-
40
-
41
-
42
-
43
-
44
-
45
-
46
-
47
-
48
-
49
-
50
-
51
-
52
-
53
-
54
-
55
-
56
-
57
-
58
-
59
-
60
-
61
-
62
-
63
-
64
-
65
-
66
-
67
-
68
-
69
-
70
-
71
-
72
-
73
-
74
-
75
-
76
-
77
-
78
-
79
-
80
-
81
-
82
-
83
-
84
-
85
-
86
-
87
-
88
-
89
-
90
-
91
-
92
-
93
-
94
-
95
-
96
-
97
-
98
-
99
-
100
-
101
-
102
-
103
-
104
-
105
-
106
-
107
-
108
-
109
-
110
-
111
-
112
-
113
-
114
-
115
-
116
-
117
-
118
-
119
-
120
-
121
-
122
-
123
-
124
-
125
-
126
-
127
-
128
-
129
-
130
-
131
-
132
-
133
-
134
-
135
-
136
-
137
-
138
-
139
-
140
-
141
-
142
-
143
-
144
 |
 |
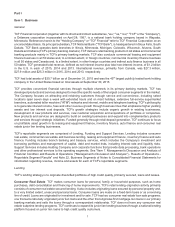
1 See “Item 7. Management’s Discussion and Analysis of Financial Condition and Results of Operations—Capital Management”
(for reconciliation of GAAP to non-GAAP measures)
2 Interest income presented on a fully tax-equivalent basis
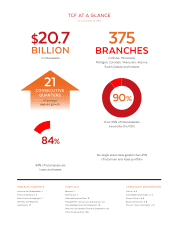
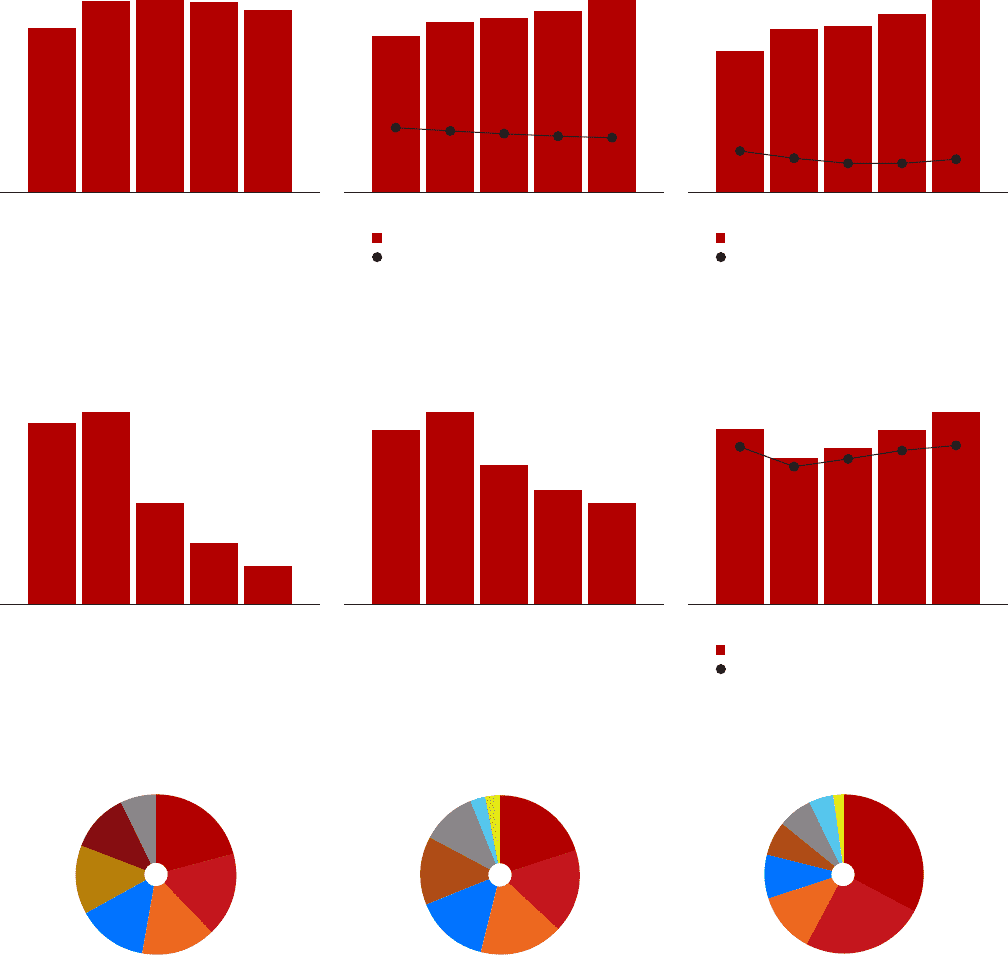
SELECT FINANCIAL HIGHLIGHTS
7
Net Interest Margin
(Percent)
3.99%
2011 2012 2013 2014 2015
4.65%4.68% 4.61% 4.42%
Loans & Leases
(Billions of dollars)
$14.2
2011 2012 2013 2014 2015
$15.4 $15.8 $16.4 $17.4
Total Loans & Leases
Average Yield on Loans & Leases
5.83% 5.53%5.27% 5.06% 4.92%
Total Deposits
Average Interest Rate on Deposits
Deposits
(Billions of dollars)
$12.2
2011 2012 2013 2014 2015
$14.1 $14.4$15.4 $16.7
0.38% 0.31% 0.26% 0.26% 0.30%
Net Charge-offs
(Percent)
2011 2012 2013 2014 2015
1.54%
0.81%
0.49%
0.30%
1.45%
Non-accrual Loans & Leases and
Other Real Estate Owned
(Millions of dollars)
2011 2012 2013 2014 2015
$476
$346
$282 $250
$433
2015 Earning Assets
$18.8 billion
■ 21% Leasing & equipment finance
■ 17% Commercial
■ 15% Consumer real estate (junior liens)
■ 14% Auto finance
■ 14% Consumer real estate & other
(first mortgages)
■ 12% Inventory finance
■ 7% Securities & other
2015 Interest Income2
$897 million
■ 20% Leasing & equipment finance
■ 17% Consumer real estate & other
(first mortgages)
■ 17% Consumer real estate (junior liens)
■ 15% Commercial
■ 14% Inventory finance
■ 11% Auto finance
■ 3% Loans & leases held for sale
■ 2% Securities
■ 1% Investments and other
2015 Non-interest Income
$442 million
■ 33% Fees & service charges
■ 25% Leasing & equipment finance
■ 12% Card revenue
■ 9% Gains on sales of consumer real
estate loans, net
■ 7% Gains on sales of auto loans, net
■ 7% Servicing fee income
■ 5% ATM revenue
■ 2% Other
Tangible Common Equity
Tangible Common Equity/Tangible Assets
Tangible Common Equity1
(Millions of dollars)
$1,635
2011 2012 2013 2014 2015
$1,366 $1,458
$1,628
$1,799
8.72%
7.59% 8.03% 8.50% 8.79%