TCF Bank 2015 Annual Report Download - page 138
Download and view the complete annual report
Please find page 138 of the 2015 TCF Bank annual report below. You can navigate through the pages in the report by either clicking on the pages listed below, or by using the keyword search tool below to find specific information within the annual report.-
 1
1 -
2
-
3
-
4
-
5
-
6
-
7
-
8
-
9
-
10
-
11
-
12
-
13
-
14
-
15
-
16
-
17
-
18
-
19
-
20
-
21
-
22
-
23
-
24
-
25
-
26
-
27
-
28
-
29
-
30
-
31
-
32
-
33
-
34
-
35
-
36
-
37
-
38
-
39
-
40
-
41
-
42
-
43
-
44
-
45
-
46
-
47
-
48
-
49
-
50
-
51
-
52
-
53
-
54
-
55
-
56
-
57
-
58
-
59
-
60
-
61
-
62
-
63
-
64
-
65
-
66
-
67
-
68
-
69
-
70
-
71
-
72
-
73
-
74
-
75
-
76
-
77
-
78
-
79
-
80
-
81
-
82
-
83
-
84
-
85
-
86
-
87
-
88
-
89
-
90
-
91
-
92
-
93
-
94
-
95
-
96
-
97
-
98
-
99
-
100
-
101
-
102
-
103
-
104
-
105
-
106
-
107
-
108
-
109
-
110
-
111
-
112
-
113
-
114
-
115
-
116
-
117
-
118
-
119
-
120
-
121
-
122
-
123
-
124
-
125
-
126
-
127
-
 128
128 -
 129
129 -
 130
130 -
 131
131 -
 132
132 -
 133
133 -
 134
134 -
 135
135 -
 136
136 -
 137
137 -
 138
138 -
 139
139 -
 140
140 -
 141
141 -
 142
142 -
 143
143 -
 144
144
 |
 |

A-4
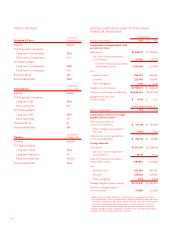
CREDIT RATINGS
Last Review
Standard & Poor’s September 2015
Outlook Stable
TCF Financial Corporation:
Long-term Counterparty BBB-
Short-term Counterparty A-3
TCF National Bank:
Long-term Counterparty BBB
Short-term Counterparty A-2
Preferred Stock BB-
Subordinated Debt BBB-
Last Review
Fitch Ratings January 2016
Outlook Stable
TCF Financial Corporation:
Long-term IDR BBB-
Short-term IDR F3
TCF National Bank:
Long-term IDR BBB-
Short-term IDR F3
Preferred Stock B
Subordinated Debt BB+
Last Review
Moody’s October 2015
Outlook Stable
TCF National Bank:
Long-term Issuer Baa2
Long-term Deposits A2
Short-term Deposits Prime-1
Subordinated Debt Baa2
RECONCILIATION OF GAAP TO NON-GAAP
FINANCIAL MEASURES1
At December 31,
(Dollars in thousands) 2015 2014
Computation of tangible book value
per common share:
Total equity $2,306,917 $ 2,135,364
Less: Non-controlling interest
in subsidiaries 16,001 13,715
Total TCF Financial Corporation
stockholders’ equity 2,290,916 2,121,649
Less:
Preferred stock 263,240 263,240
Goodwill 225,640 225,640
Other intangibles 3,126 4,641
Tangible common equity $ 1,798,910 $ 1,628,128
Common stock shares outstanding 169,844,464 167,461,002
Tangible book value per
common share $ 10.59 $ 9.72
Year Ended December 31,
(Dollars in thousands) 2015 2014
Computation of return on average
tangible common equity:
Net income available to
common stockholders $ 177,735 $ 154,799
Other intangibles amortization,
net of tax 1,000 1,062
Adjusted net income available to
common stockholders $ 178,735 $ 155,861
Average balances:
Total equity $2,217,204 $2,058,442
Less: Non-controlling interest
in subsidiaries 19,514 17,014
Total TCF Financial Corporation
stockholders’ equity 2,197,690 2,041,428
Less:
Preferred stock 263,240 263,240
Goodwill 225,640 225,640
Other intangibles 3,913 5,498
Average tangible common equity $1,704,897 $ 1,547,050
Return on average tangible
common equity 10.48% 10.08%
1 When evaluating capital adequacy and utilization, management considers
financial measures such as tangible book value per common share and return
on average tangible common equity. These measures are non-GAAP financial
measures and are viewed by management as useful indicators of capital
levels available to withstand unexpected market or economic conditions
and also provide investors, regulators and other users with information to be
viewed in relation to other banking institutions.