TCF Bank 2015 Annual Report Download - page 57
Download and view the complete annual report
Please find page 57 of the 2015 TCF Bank annual report below. You can navigate through the pages in the report by either clicking on the pages listed below, or by using the keyword search tool below to find specific information within the annual report.-
 1
1 -
2
-
3
-
4
-
5
-
6
-
7
-
8
-
9
-
10
-
11
-
12
-
13
-
14
-
15
-
16
-
17
-
18
-
19
-
20
-
21
-
22
-
23
-
24
-
25
-
26
-
27
-
28
-
29
-
30
-
31
-
32
-
33
-
34
-
35
-
36
-
37
-
38
-
39
-
40
-
41
-
42
-
43
-
44
-
45
-
46
-
 47
47 -
 48
48 -
 49
49 -
 50
50 -
 51
51 -
 52
52 -
 53
53 -
 54
54 -
 55
55 -
 56
56 -
 57
57 -
 58
58 -
 59
59 -
 60
60 -
 61
61 -
 62
62 -
 63
63 -
 64
64 -
 65
65 -
 66
66 -
 67
67 -
68
-
69
-
70
-
71
-
72
-
73
-
74
-
75
-
76
-
77
-
78
-
79
-
80
-
81
-
82
-
83
-
84
-
85
-
86
-
87
-
88
-
89
-
90
-
91
-
92
-
93
-
94
-
95
-
96
-
97
-
98
-
99
-
100
-
101
-
102
-
103
-
104
-
105
-
106
-
107
-
108
-
109
-
110
-
111
-
112
-
113
-
114
-
115
-
116
-
117
-
118
-
119
-
120
-
121
-
122
-
123
-
124
-
125
-
126
-
127
-
128
-
129
-
130
-
131
-
132
-
133
-
134
-
135
-
136
-
137
-
138
-
139
-
140
-
141
-
142
-
143
-
144
 |
 |

42
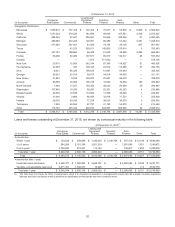
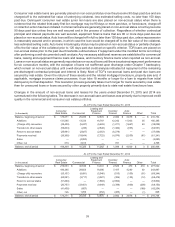
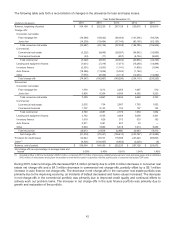
The following table sets forth a reconciliation of changes in the allowance for loan and lease losses.
Year Ended December 31,
(Dollars in thousands) 2015 2014 2013 2012 2011
Balance, beginning of period $ 164,169 $ 252,230 $ 267,128 $ 255,672 $ 265,819
Charge-offs:
Consumer real estate:
First mortgage lien (19,448) (43,632) (60,363) (101,595) (94,724)
Junior lien (14,239) (19,494) (37,145) (83,190) (62,130)
Total consumer real estate (33,687) (63,126) (97,508) (184,785)(156,854)
Commercial:
Commercial real estate (5,225) (8,646) (28,287) (34,642) (32,890)
Commercial business (24)(11)(657) (6,194) (9,843)
Total commercial (5,249) (8,657) (28,944) (40,836) (42,733)
Leasing and equipment finance (7,631) (7,316) (7,277) (15,248) (16,984)
Inventory finance (2,501) (1,653) (1,141) (1,838) (1,044)
Auto finance (18,386) (11,856) (5,305) (1,164) —
Other (7,093) (8,359) (9,115) (10,239) (12,680)
Total charge-offs (74,547) (100,967)(149,290)(254,110)(230,295)
Recoveries:
Consumer real estate:
First mortgage lien 1,578 1,513 2,055 1,067 510
Junior lien 5,850 5,354 6,589 4,582 3,233
Total consumer real estate 7,428 6,867 8,644 5,649 3,743
Commercial:
Commercial real estate 2,032 754 2,667 1,762 1,502
Commercial business 1,737 2,133 103 197 152
Total commercial 3,769 2,887 2,770 1,959 1,654
Leasing and equipment finance 2,792 3,705 3,968 5,058 4,461
Inventory finance 1,019 826 373 333 193
Auto finance 2,971 1,491 607 30 —
Other 5,034 5,860 6,518 7,314 9,262
Total recoveries 23,013 21,636 22,880 20,343 19,313
Net charge-offs (51,534) (79,331) (126,410)(233,767)(210,982)
Provision for credit losses 52,944 95,737 118,368 247,443 200,843
Other(1) (9,525)(104,467) (6,856) (2,220) (8)
Balance, end of period $ 156,054 $ 164,169 $ 252,230 $ 267,128 $ 255,672
Net charge-offs as a percentage of average loans and
leases 0.30%0.49%0.81%1.54%1.45%
(1) Included in Other in 2014 is the transfer of $95.3 million, comprised of $77.0 million of previously established allowance for loan and lease losses and an additional
$18.3 million of write-downs arising from the transfer to loans held for sale in conjunction with the portfolio sale of consumer real estate TDR loans.
During 2015, total net charge-offs decreased $27.8 million primarily due to a $30.0 million decrease in consumer real
estate net charge-offs and a $4.3 million decrease in commercial net charge-offs, partially offset by a $5.1 million
increase in auto finance net charge-offs. The decrease in net charge-offs in the consumer real estate portfolio was
primarily due to the improving economy, as incidents of default decreased and home values increased. The decrease
in net charge-offs in the commercial portfolio was primarily due to improved credit quality and continued efforts to
actively work out problem loans. The increase in net charge-offs in the auto finance portfolio was primarily due to
growth and maturation of the portfolio.