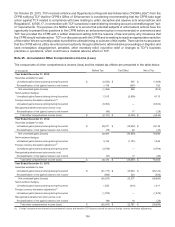
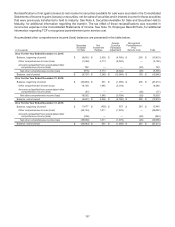
TCF Bank 2015 Annual Report Download - page 123
Download and view the complete annual report
Please find page 123 of the 2015 TCF Bank annual report below. You can navigate through the pages in the report by either clicking on the pages listed below, or by using the keyword search tool below to find specific information within the annual report.-
 1
1 -
2
-
3
-
4
-
5
-
6
-
7
-
8
-
9
-
10
-
11
-
12
-
13
-
14
-
15
-
16
-
17
-
18
-
19
-
20
-
21
-
22
-
23
-
24
-
25
-
26
-
27
-
28
-
29
-
30
-
31
-
32
-
33
-
34
-
35
-
36
-
37
-
38
-
39
-
40
-
41
-
42
-
43
-
44
-
45
-
46
-
47
-
48
-
49
-
50
-
51
-
52
-
53
-
54
-
55
-
56
-
57
-
58
-
59
-
60
-
61
-
62
-
63
-
64
-
65
-
66
-
67
-
68
-
69
-
70
-
71
-
72
-
73
-
74
-
75
-
76
-
77
-
78
-
79
-
80
-
81
-
82
-
83
-
84
-
85
-
86
-
87
-
88
-
89
-
90
-
91
-
92
-
93
-
94
-
95
-
96
-
97
-
98
-
99
-
100
-
101
-
102
-
103
-
104
-
105
-
106
-
107
-
108
-
109
-
110
-
111
-
112
-
 113
113 -
 114
114 -
 115
115 -
 116
116 -
 117
117 -
 118
118 -
 119
119 -
 120
120 -
 121
121 -
 122
122 -
 123
123 -
 124
124 -
 125
125 -
 126
126 -
 127
127 -
 128
128 -
 129
129 -
 130
130 -
 131
131 -
 132
132 -
 133
133 -
134
-
135
-
136
-
137
-
138
-
139
-
140
-
141
-
142
-
143
-
144
 |
 |

108
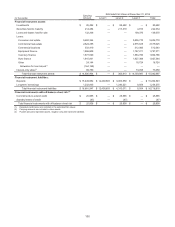
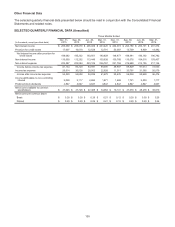
Other Financial Data
The selected quarterly financial data presented below should be read in conjunction with the Consolidated Financial
Statements and related notes.
SELECTED QUARTERLY FINANCIAL DATA (Unaudited)
Three Months Ended
(In thousands, except per-share data) Dec. 31,
2015 Sep. 30,
2015 Jun. 30,
2015 Mar. 31,
2015 Dec. 31,
2014 Sep. 30,
2014 Jun. 30,
2014 Mar. 31,
2014
Net interest income $ 205,669 $ 205,270 $ 206,029 $ 203,420 $ 204,074 $ 204,180 $ 206,101 $201,274
Provision for credit losses 17,607 10,018 12,528 12,791 55,597 15,739 9,909 14,492
Net interest income after provision for
credit losses 188,062 195,252 193,501 190,629 148,477 188,441 196,192 186,782
Non-interest income 115,659 112,252 113,449 100,638 109,768 116,076 104,016 103,407
Non-interest expense 222,587 222,284 223,109 226,767 221,758 219,688 213,195 217,136
Income before income tax expense 81,134 85,220 83,841 64,500 36,487 84,829 87,013 73,053
Income tax expense 26,614 30,528 28,902 22,828 11,011 30,791 31,385 26,579
Income after income tax expense 54,520 54,692 54,939 41,672 25,476 54,038 55,628 46,474
Income attributable to non-controlling
interest 2,028 2,117 2,684 1,871 1,488 1,721 2,503 1,717
Preferred stock dividends 4,847 4,847 4,847 4,847 4,847 4,847 4,847 4,847
Net income available to common
stockholders $ 47,645 $ 47,728 $47,408 $34,954 $19,141 $47,470 $48,278 $39,910
Net income per common share:
Basic $ 0.29 $ 0.29 $ 0.29 $0.21 $0.12 $0.29 $0.30 $0.25
Diluted $ 0.29 $ 0.29 $ 0.29 $0.21 $0.12 $0.29 $0.29 $0.24