TCF Bank 2015 Annual Report Download - page 44
Download and view the complete annual report
Please find page 44 of the 2015 TCF Bank annual report below. You can navigate through the pages in the report by either clicking on the pages listed below, or by using the keyword search tool below to find specific information within the annual report.-
 1
1 -
2
-
3
-
4
-
5
-
6
-
7
-
8
-
9
-
10
-
11
-
12
-
13
-
14
-
15
-
16
-
17
-
18
-
19
-
20
-
21
-
22
-
23
-
24
-
25
-
26
-
27
-
28
-
29
-
30
-
31
-
32
-
33
-
 34
34 -
 35
35 -
 36
36 -
 37
37 -
 38
38 -
 39
39 -
 40
40 -
 41
41 -
 42
42 -
 43
43 -
 44
44 -
 45
45 -
 46
46 -
 47
47 -
 48
48 -
 49
49 -
 50
50 -
 51
51 -
 52
52 -
 53
53 -
 54
54 -
55
-
56
-
57
-
58
-
59
-
60
-
61
-
62
-
63
-
64
-
65
-
66
-
67
-
68
-
69
-
70
-
71
-
72
-
73
-
74
-
75
-
76
-
77
-
78
-
79
-
80
-
81
-
82
-
83
-
84
-
85
-
86
-
87
-
88
-
89
-
90
-
91
-
92
-
93
-
94
-
95
-
96
-
97
-
98
-
99
-
100
-
101
-
102
-
103
-
104
-
105
-
106
-
107
-
108
-
109
-
110
-
111
-
112
-
113
-
114
-
115
-
116
-
117
-
118
-
119
-
120
-
121
-
122
-
123
-
124
-
125
-
126
-
127
-
128
-
129
-
130
-
131
-
132
-
133
-
134
-
135
-
136
-
137
-
138
-
139
-
140
-
141
-
142
-
143
-
144
 |
 |

29
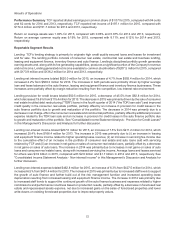
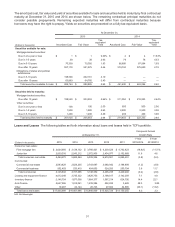
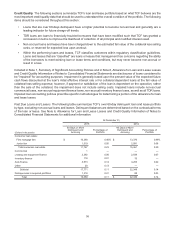
Gains on Sales of Consumer Real Estate Loans, Net In 2015, TCF recognized net gains of $39.8 million, excluding
subsequent adjustments and valuation adjustments while held for sale, on the recorded investment of $1.3 billion in
consumer real estate loans sold, including accrued interest. In 2014, TCF recognized net gains of $34.1 million,
excluding subsequent adjustments and valuation adjustments while held for sale, on the recorded investment of
$1.4 billion in consumer real estate loans sold, including accrued interest. In 2013, TCF recognized net gains of
$21.7 million on the recorded investment of $766.3 million in consumer real estate loans sold, including accrued
interest. Included in 2014 were loan balances of $405.9 million related to the TDR loan sale, which resulted in a net
loss of $4.8 million. TCF has two consumer real estate loan sale programs; one that sells nationally originated consumer
real estate junior lien loans and the other that originates first mortgage lien loans in our primary banking markets and
sells the loans through a correspondent relationship. Included in the consumer real estate recognized net gains was
$6.4 million and $0.9 million, excluding subsequent adjustments and valuation adjustments while held for sale, on the
recorded investments of $289.8 million and $39.2 million in first mortgage lien loans sold related to the correspondent
lending program, including accrued interest, for 2015 and 2014, respectively. There were no sales of correspondent
lending loans in 2013. See Note 5, Loans and Leases of Notes to Consolidated Financial Statements for additional
information.
Servicing Fee Income Servicing fee income totaled $31.2 million for 2015, compared with $21.4 million and $13.4 million
for 2014 and 2013, respectively. The increases from both periods were primarily due to the cumulative effect of an
increase in the portfolio of auto and consumer real estate loans sold with servicing retained by TCF. Average loans
and leases serviced for others was $3.9 billion for 2015, compared with $2.9 billion and $1.7 billion for 2014 and 2013,
respectively.
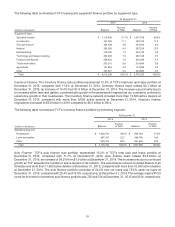
Leasing and Equipment Finance Leasing and equipment finance income totaled $108.1 million for 2015, compared
with $93.8 million and $90.9 million for 2014 and 2013, respectively. The increases in both periods were primarily due
to higher operating lease revenue.
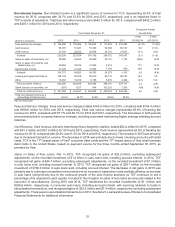
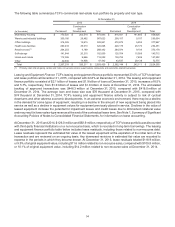
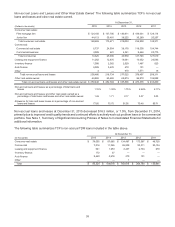
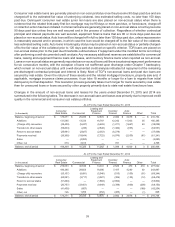
Non-interest Expense Non-interest expense totaled $894.7 million for 2015, compared with $871.8 million and
$845.3 million for 2014 and 2013, respectively. Non-interest expense increased $23.0 million, or 2.6%, in 2015 and
increased $26.5 million, or 3.1%, in 2014. The following table presents the components of non-interest expense.
Compound Annual
Year Ended December 31, Growth Rate
1-Year 5-Year
(Dollars in thousands) 2015 2014 2013 2012 2011 2015/2014 2015/2010
Compensation and employee benefits $ 457,743 $ 452,942 $ 429,188 $ 393,841 $ 348,792 1.1% 5.8%
Occupancy and equipment 144,962 139,023 134,694 130,792 126,437 4.3 2.8
FDIC insurance 20,262 25,123 32,066 30,425 28,747 (19.3)(3.0)
Advertising and marketing 22,782 22,943 21,477 25,241 32,925 (0.7)(5.6)
Other 186,211 179,904 167,777 163,897 145,489 3.5 4.9
Subtotal 831,960 819,935 785,202 744,196 682,390 1.5 4.3
Operating lease depreciation 39,409 27,152 24,500 25,378 30,007 45.1 1.2
Loss on termination of debt — — — 550,735 — — —
Branch realignment — — 8,869 — — — —
Foreclosed real estate and
repossessed assets, net 23,193 24,567 27,950 41,358 49,238 (5.6)(10.5)
Other credit costs, net 185 123 (1,252) 887 2,816 50.4 (50.2)
Total non-interest expense $ 894,747 $ 871,777 $ 845,269 $1,362,554 $ 764,451 2.6 3.4
Compensation and Employee Benefits Compensation and employee benefits expense totaled $457.7 million for 2015,
compared with $452.9 million and $429.2 million for 2014 and 2013, respectively. The increase in 2015 was primarily
due to the increased staff levels to support the growth of auto finance and further build-out of the risk management
function, partially offset by non-recurring items, including the annual pension plan valuation adjustment resulting from
an increase to the discount rate. The increase in 2014 was primarily due to increased staff levels to support the growth
and needs of auto finance and risk management, higher commissions based on production results and an increase
in the annual pension plan valuation adjustment.