TCF Bank 2015 Annual Report Download - page 46
Download and view the complete annual report
Please find page 46 of the 2015 TCF Bank annual report below. You can navigate through the pages in the report by either clicking on the pages listed below, or by using the keyword search tool below to find specific information within the annual report.-
 1
1 -
2
-
3
-
4
-
5
-
6
-
7
-
8
-
9
-
10
-
11
-
12
-
13
-
14
-
15
-
16
-
17
-
18
-
19
-
20
-
21
-
22
-
23
-
24
-
25
-
26
-
27
-
28
-
29
-
30
-
31
-
32
-
33
-
34
-
35
-
 36
36 -
 37
37 -
 38
38 -
 39
39 -
 40
40 -
 41
41 -
 42
42 -
 43
43 -
 44
44 -
 45
45 -
 46
46 -
 47
47 -
 48
48 -
 49
49 -
 50
50 -
 51
51 -
 52
52 -
 53
53 -
 54
54 -
 55
55 -
 56
56 -
57
-
58
-
59
-
60
-
61
-
62
-
63
-
64
-
65
-
66
-
67
-
68
-
69
-
70
-
71
-
72
-
73
-
74
-
75
-
76
-
77
-
78
-
79
-
80
-
81
-
82
-
83
-
84
-
85
-
86
-
87
-
88
-
89
-
90
-
91
-
92
-
93
-
94
-
95
-
96
-
97
-
98
-
99
-
100
-
101
-
102
-
103
-
104
-
105
-
106
-
107
-
108
-
109
-
110
-
111
-
112
-
113
-
114
-
115
-
116
-
117
-
118
-
119
-
120
-
121
-
122
-
123
-
124
-
125
-
126
-
127
-
128
-
129
-
130
-
131
-
132
-
133
-
134
-
135
-
136
-
137
-
138
-
139
-
140
-
141
-
142
-
143
-
144
 |
 |

31
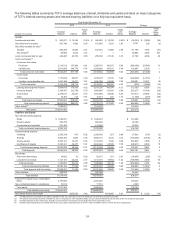
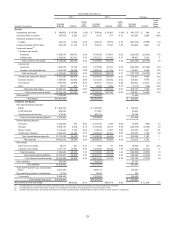
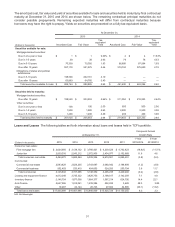
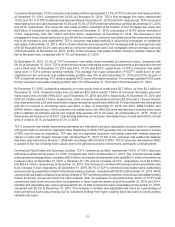
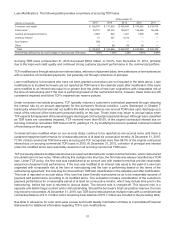
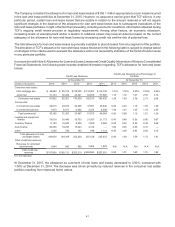
The amortized cost, fair value and yield of securities available for sale and securities held to maturity by final contractual
maturity at December 31, 2015 and 2014 are shown below. The remaining contractual principal maturities do not
consider possible prepayments. Remaining expected maturities will differ from contractual maturities because
borrowers may have the right to prepay. Yields on securities are presented on a fully tax-equivalent basis.
At December 31,
2015 2014
(Dollars in thousands) Amortized Cost Fair Value
Tax-
equivalent
Yield Amortized Cost Fair Value
Tax-
equivalent
Yield
Securities available for sale:
Mortgage-backed securities:
Due in one year or less $ 1 $ 1 9.00% $ 4 $ 4 11.63%
Due in 1-5 years 38 38 2.65 76 76 4.53
Due in 5-10 years 70,338 70,350 1.93 86,806 87,594 1.93
Due after 10 years 557,178 551,575 2.46 374,744 375,620 2.78
Obligations of states and political
subdivisions:
Due in 5-10 years 198,300 202,161 3.19 — — —
Due after 10 years 63,889 64,760 3.40 — — —
Total securities available for sale $ 889,744 $ 888,885 2.65 $ 461,630 $ 463,294 2.62
Securities held to maturity:
Mortgage-backed securities:
Due after 10 years $ 198,520 $ 203,553 2.64% $ 211,054 $ 218,933 2.64%
Other securities:
Due in one year or less 100 100 2.00 500 500 2.00
Due in 1-5 years 1,900 1,900 2.63 2,500 2,500 3.08
Due in 5-10 years 1,400 1,400 3.36 400 400 3.00
Total securities held to maturity $ 201,920 $ 206,953 2.64 $ 214,454 $ 222,333 2.64
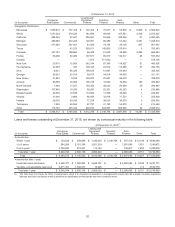
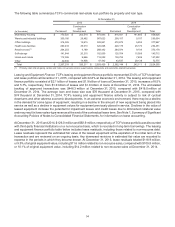
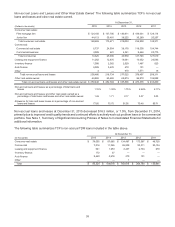
Loans and Leases The following tables set forth information about loans and leases held in TCF's portfolio.
Compound Annual
At December 31, Growth Rate
1-Year 5-Year
(Dollars in thousands) 2015 2014 2013 2012 2011 2015/2014 2015/2010
Consumer real estate:
First mortgage lien $ 2,624,956 $ 3,139,152 $ 3,766,421 $4,239,524 $4,742,423 (16.4)% (11.7)%
Junior lien 2,839,316 2,543,212 2,572,905 2,434,977 2,152,868 11.6 4.6
Total consumer real estate 5,464,272 5,682,364 6,339,326 6,674,501 6,895,291 (3.8) (5.3)
Commercial:
Commercial real estate 2,593,429 2,624,255 2,743,697 3,080,942 3,198,698 (1.2) (4.9)
Commercial business 552,403 533,410 404,655 324,293 250,794 3.6 11.7
Total commercial 3,145,832 3,157,665 3,148,352 3,405,235 3,449,492 (0.4) (2.9)
Leasing and equipment finance 4,012,248 3,745,322 3,428,755 3,198,017 3,142,259 7.1 4.9
Inventory finance 2,146,754 1,877,090 1,664,377 1,567,214 624,700 14.4 22.1
Auto finance 2,647,596 1,915,061 1,239,386 552,833 3,628 38.3 N.M.
Other 19,297 24,144 26,743 27,924 34,885 (20.1) (13.2)
Total loans and leases $17,435,999 $16,401,646 $15,846,939 $15,425,724 $14,150,255 6.3 3.3
N.M. Not Meaningful.