TCF Bank 2015 Annual Report Download - page 113
Download and view the complete annual report
Please find page 113 of the 2015 TCF Bank annual report below. You can navigate through the pages in the report by either clicking on the pages listed below, or by using the keyword search tool below to find specific information within the annual report.-
 1
1 -
2
-
3
-
4
-
5
-
6
-
7
-
8
-
9
-
10
-
11
-
12
-
13
-
14
-
15
-
16
-
17
-
18
-
19
-
20
-
21
-
22
-
23
-
24
-
25
-
26
-
27
-
28
-
29
-
30
-
31
-
32
-
33
-
34
-
35
-
36
-
37
-
38
-
39
-
40
-
41
-
42
-
43
-
44
-
45
-
46
-
47
-
48
-
49
-
50
-
51
-
52
-
53
-
54
-
55
-
56
-
57
-
58
-
59
-
60
-
61
-
62
-
63
-
64
-
65
-
66
-
67
-
68
-
69
-
70
-
71
-
72
-
73
-
74
-
75
-
76
-
77
-
78
-
79
-
80
-
81
-
82
-
83
-
84
-
85
-
86
-
87
-
88
-
89
-
90
-
91
-
92
-
93
-
94
-
95
-
96
-
97
-
98
-
99
-
100
-
101
-
102
-
 103
103 -
 104
104 -
 105
105 -
 106
106 -
 107
107 -
 108
108 -
 109
109 -
 110
110 -
 111
111 -
 112
112 -
 113
113 -
 114
114 -
 115
115 -
 116
116 -
 117
117 -
 118
118 -
 119
119 -
 120
120 -
 121
121 -
 122
122 -
 123
123 -
124
-
125
-
126
-
127
-
128
-
129
-
130
-
131
-
132
-
133
-
134
-
135
-
136
-
137
-
138
-
139
-
140
-
141
-
142
-
143
-
144
 |
 |

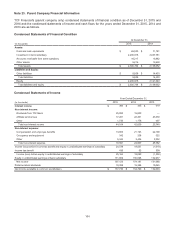
98
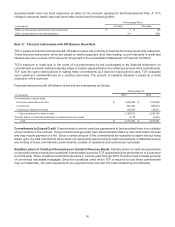
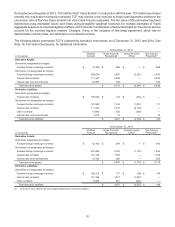
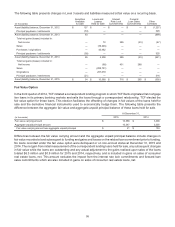
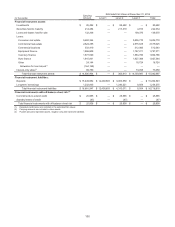
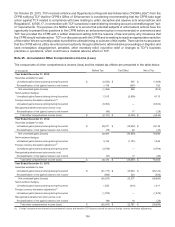
The following table presents changes in Level 3 assets and liabilities measured at fair value on a recurring basis.
(In thousands)
Securities
Available
for Sale
Loans and
Leases
Held for Sale
Interest
Rate Lock
Commitments
Forward
Loan Sales
Commitments Other
Contracts
Asset (liability) balance, December 31, 2012 $ 127 $ — $ — $ — $ (1,227)
Principal paydowns / settlements (34) — — — 328
Asset (liability) balance, December 31, 2013 93 ———(899)
Total net gains (losses) included in:
Net income — 72 285 (23)(47)
Sales — (39,246) — — —
Purchases / originations — 42,482 ———
Principal paydowns / settlements (38) — — — 325
Asset (liability) balance, December 31, 2014 55 3,308 285 (23)(621)
Total net gains (losses) included in:
Net income — (68)431 288 —
Sales — (289,751) — — —
Originations — 297,079 — — —
Principal paydowns / settlements (21) — — — 316
Asset (liability) balance, December 31, 2015 $34 $10,568 $716 $265 $(305)
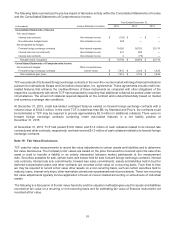
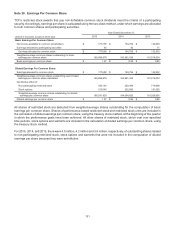
Fair Value Option
In the third quarter of 2014, TCF initiated a correspondent lending program in which TCF Bank originates first mortgage
lien loans in its primary banking markets and sells the loans through a correspondent relationship. TCF elected the
fair value option for these loans. This election facilitates the offsetting of changes in fair values of the loans held for
sale and the derivative financial instruments used to economically hedge them. The following table presents the
difference between the aggregate fair value and aggregate unpaid principal balance of these loans held for sale.
At December 31,
(In thousands) 2015 2014
Fair value carrying amount $ 10,568 $ 3,308
Aggregate unpaid principal amount 10,547 3,205
Fair value carrying amount less aggregate unpaid principal $ 21 $ 103
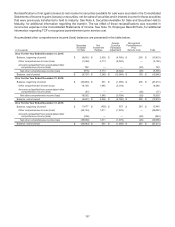
Differences between the fair value carrying amount and the aggregate unpaid principal balance include changes in
fair value recorded at and subsequent to funding and gains and losses on the related loan commitment prior to funding.
No loans recorded under the fair value option were delinquent or on non-accrual status at December 31, 2015 and
2014. The net gain from initial measurement of the correspondent lending loans held for sale, any subsequent changes
in fair value while the loans are outstanding and any actual adjustment to the gains realized upon sales of the loans
totaled $6.3 million and $0.9 million for 2015 and 2014, respectively, and is included in gains on sales of consumer
real estate loans, net. This amount excludes the impact from the interest rate lock commitments and forward loan
sales commitments which are also included in gains on sales of consumer real estate loans, net.