TCF Bank 2015 Annual Report Download - page 73
Download and view the complete annual report
Please find page 73 of the 2015 TCF Bank annual report below. You can navigate through the pages in the report by either clicking on the pages listed below, or by using the keyword search tool below to find specific information within the annual report.-
 1
1 -
2
-
3
-
4
-
5
-
6
-
7
-
8
-
9
-
10
-
11
-
12
-
13
-
14
-
15
-
16
-
17
-
18
-
19
-
20
-
21
-
22
-
23
-
24
-
25
-
26
-
27
-
28
-
29
-
30
-
31
-
32
-
33
-
34
-
35
-
36
-
37
-
38
-
39
-
40
-
41
-
42
-
43
-
44
-
45
-
46
-
47
-
48
-
49
-
50
-
51
-
52
-
53
-
54
-
55
-
56
-
57
-
58
-
59
-
60
-
61
-
62
-
 63
63 -
 64
64 -
 65
65 -
 66
66 -
 67
67 -
 68
68 -
 69
69 -
 70
70 -
 71
71 -
 72
72 -
 73
73 -
 74
74 -
 75
75 -
 76
76 -
 77
77 -
 78
78 -
 79
79 -
 80
80 -
 81
81 -
 82
82 -
 83
83 -
84
-
85
-
86
-
87
-
88
-
89
-
90
-
91
-
92
-
93
-
94
-
95
-
96
-
97
-
98
-
99
-
100
-
101
-
102
-
103
-
104
-
105
-
106
-
107
-
108
-
109
-
110
-
111
-
112
-
113
-
114
-
115
-
116
-
117
-
118
-
119
-
120
-
121
-
122
-
123
-
124
-
125
-
126
-
127
-
128
-
129
-
130
-
131
-
132
-
133
-
134
-
135
-
136
-
137
-
138
-
139
-
140
-
141
-
142
-
143
-
144
 |
 |

58
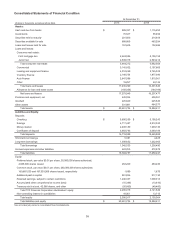
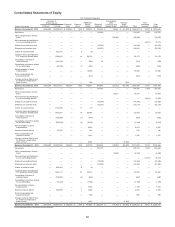
Consolidated Statements of Equity
TCF Financial Corporation
Number of
Shares Issued Preferred
Stock Common
Stock
Additional
Paid-in
Capital Retained
Earnings
Accumulated
Other
Comprehensive
Income (Loss)
Treasury
Stock
and Other Total
Non-
controlling
Interests Total
Equity
(Dollars in thousands) Preferred Common
Balance, December 31, 2012 4,006,900 163,428,763 $ 263,240 $ 1,634 $ 750,040 $ 877,445 $ 12,443 $ (41,429) $ 1,863,373 $ 13,270 $ 1,876,643
Net income — — — — — 151,668 — — 151,668 7,032 158,700
Other comprehensive income
(loss) — — — — — — (39,656) — (39,656) — (39,656)
Net investment by (distribution
to) non-controlling interest — — — — — — — — — (8,511) (8,511)
Dividends on preferred stock — — — — — (19,065) — — (19,065) — (19,065)
Dividends on common stock — — — — — (32,227) — — (32,227) — (32,227)
Grants of restricted stock — 532,777 — 5 (5) — — — — — —
Common shares purchased by
TCF employee benefit plans — 1,389,819 — 14 20,165 — — — 20,179 — 20,179
Cancellation of shares of
restricted stock — (120,313) — — (299) 25 — — (274) — (274)
Cancellation of common shares
for tax withholding — (66,185) — (1) (954) — — — (955) — (955)
Net amortization of stock
compensation — — — — 10,398 — — — 10,398 — 10,398
Stock compensation tax
(expense) benefit — — — — (473) — — — (473) — (473)
Change in shares held in trust
for deferred compensation
plans, at cost — — — — 769 — — (769) — — —
Balance, December 31, 2013 4,006,900 165,164,861 263,240 1,652 779,641 977,846 (27,213) (42,198) 1,952,968 11,791 1,964,759
Net income — — — — — 174,187 — — 174,187 7,429 181,616
Other comprehensive income
(loss) — — — — — — 16,303 — 16,303 — 16,303
Net investment by (distribution
to) non-controlling interest — — — — — — — — — (5,505) (5,505)
Dividends on preferred stock — — — — — (19,388) — — (19,388) — (19,388)
Dividends on common stock — — — — — (32,731) — — (32,731) — (32,731)
Grants of restricted stock — 1,152,906 — 11 (11) — — — — — —
Common shares purchased by
TCF employee benefit plans — 1,452,837 — 15 23,068 — — — 23,083 — 23,083
Cancellation of shares of
restricted stock — (108,490) — (1) (519) — — — (520) — (520)
Cancellation of common shares
for tax withholding — (205,546) — (2) (3,332) — — — (3,334) — (3,334)
Net amortization of stock
compensation — — — — 9,025 — — — 9,025 — 9,025
Exercise of stock options — 47,000 — — 740 — — — 740 — 740
Stock compensation tax
(expense) benefit — — — — 1,316 — — — 1,316 — 1,316
Change in shares held in trust
for deferred compensation
plans, at cost — — — — 7,202 — — (7,202) — — —
Balance, December 31, 2014 4,006,900 167,503,568 263,240 1,675 817,130 1,099,914 (10,910) (49,400) 2,121,649 13,715 2,135,364
Net income — — — — — 197,123 — — 197,123 8,700 205,823
Other comprehensive income
(loss) — — — — — — (4,436) — (4,436) — (4,436)
Net investment by (distribution
to) non-controlling interest — — — — — — — — — (6,414) (6,414)
Dividends on preferred stock — — — — — (19,388) — — (19,388) — (19,388)
Dividends on common stock — — — — — (37,302) — — (37,302) — (37,302)
Grants of restricted stock — 828,304 — 8 (8) — — — — — —
Common shares purchased by
TCF employee benefit plans — 1,588,111 — 16 24,819 — — — 24,835 — 24,835
Cancellation of shares of
restricted stock — (159,522) — (2) (685) — — — (687) — (687)
Cancellation of common shares
for tax withholding — (73,431) — — (1,166) — — — (1,166) — (1,166)
Net amortization of stock
compensation — — — — 7,160 — — — 7,160 — 7,160
Exercise of stock options — 200,000 — 2 2,568 — — — 2,570 — 2,570
Stock compensation tax
(expense) benefit — — — — 558 — — — 558 — 558
Change in shares held in trust
for deferred compensation
plans, at cost — — — — 1,460 — — (1,460) — — —
Balance, December 31, 2015 4,006,900 169,887,030 $ 263,240 $ 1,699 $ 851,836 $ 1,240,347 $ (15,346) $ (50,860) $ 2,290,916 $ 16,001 $ 2,306,917
See accompanying notes to consolidated financial statements.