TCF Bank 2015 Annual Report Download - page 41
Download and view the complete annual report
Please find page 41 of the 2015 TCF Bank annual report below. You can navigate through the pages in the report by either clicking on the pages listed below, or by using the keyword search tool below to find specific information within the annual report.-
 1
1 -
2
-
3
-
4
-
5
-
6
-
7
-
8
-
9
-
10
-
11
-
12
-
13
-
14
-
15
-
16
-
17
-
18
-
19
-
20
-
21
-
22
-
23
-
24
-
25
-
26
-
27
-
28
-
29
-
30
-
 31
31 -
 32
32 -
 33
33 -
 34
34 -
 35
35 -
 36
36 -
 37
37 -
 38
38 -
 39
39 -
 40
40 -
 41
41 -
 42
42 -
 43
43 -
 44
44 -
 45
45 -
 46
46 -
 47
47 -
 48
48 -
 49
49 -
 50
50 -
 51
51 -
52
-
53
-
54
-
55
-
56
-
57
-
58
-
59
-
60
-
61
-
62
-
63
-
64
-
65
-
66
-
67
-
68
-
69
-
70
-
71
-
72
-
73
-
74
-
75
-
76
-
77
-
78
-
79
-
80
-
81
-
82
-
83
-
84
-
85
-
86
-
87
-
88
-
89
-
90
-
91
-
92
-
93
-
94
-
95
-
96
-
97
-
98
-
99
-
100
-
101
-
102
-
103
-
104
-
105
-
106
-
107
-
108
-
109
-
110
-
111
-
112
-
113
-
114
-
115
-
116
-
117
-
118
-
119
-
120
-
121
-
122
-
123
-
124
-
125
-
126
-
127
-
128
-
129
-
130
-
131
-
132
-
133
-
134
-
135
-
136
-
137
-
138
-
139
-
140
-
141
-
142
-
143
-
144
 |
 |

26
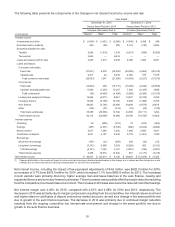
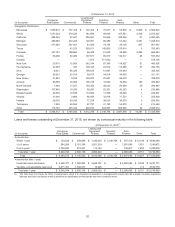
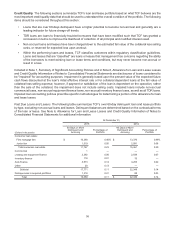
The following table presents the components of the changes in net interest income by volume and rate.
Year Ended
December 31, 2015 December 31, 2014
Versus Same Period in 2014 Versus Same Period in 2013
Increase (Decrease) Due to Increase (Decrease) Due to
(In thousands) Volume(1) Rate(1) Total Volume(1) Rate(1) Total
Interest income:
Investments and other $ (1,645) $ (1,451) $ (3,096) $ (4,046) $ 4,395 $349
Securities held to maturity 245 (40)205 5,134 (130)5,004
Securities available for sale:
Taxable 2,952 (1,016) 1,936 (5,431) (649) (6,080)
Tax-exempt 2,643 — 2,643 — — —
Loans and leases held for sale 2,325 2,313 4,638 8,388 1,093 9,481
Loans and leases:
Consumer real estate:
Fixed-rate (37,621) 4,076 (33,545) (22,055) (4,863) (26,918)
Variable-rate 6,317 22 6,339 4,365 874 5,239
Total consumer real estate (28,753) 1,547 (27,206) (16,452) (5,227) (21,679)
Commercial:
Fixed-rate (14,924) 209 (14,715) (15,365) (4,643) (20,008)
Variable- and adjustable-rate 11,580 (1,353) 10,227 7,045 (2,347) 4,698
Total commercial (42) (4,446) (4,488) (5,926) (9,384) (15,310)
Leasing and equipment finance 12,662 (4,071) 8,591 13,047 (8,108) 4,939
Inventory finance 15,346 (5,150) 10,196 9,839 (1,080) 8,759
Auto finance 29,633 (3,765) 25,868 29,246 (4,572) 24,674
Other (128) (91) (219) (79)(50)(129)
Total loans and leases 35,838 (23,096) 12,742 34,365 (33,111) 1,254
Total interest income 43,114 (24,046) 19,068 28,790 (18,782) 10,008
Interest expense:
Checking 26 (400) (374) 10 (574)(564)
Savings (987) (4,351) (5,338) (865) (3,229) (4,094)
Money market 5,817 1,388 7,205 1,946 2,695 4,641
Certificates of deposit 4,221 4,127 8,348 3,779 (1,981) 1,798
Borrowings:
Short-term borrowings (187) (21) (208) 248 (33)215
Long-term borrowings (3,191) 6,500 3,309 (6,265) 953 (5,312)
Total borrowings (4,161) 7,262 3,101 (4,901) (196) (5,097)
Total interest expense 2,268 10,674 12,942 861 (4,177) (3,316)
Net interest income $ 40,037 $ (33,911) $ 6,126 $ 26,802 $ (13,478) $ 13,324
(1) Changes attributable to the combined impact of volume and rate have been allocated proportionately to the change due to volume and the change due to rate.
Changes due to volume and rate are calculated independently for each line item presented.
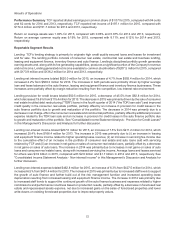
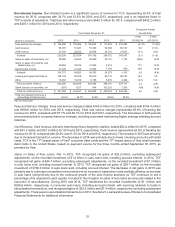
Net interest income, including the impact of tax-equivalent adjustments of $4.6 million, was $825.0 million for 2015,
an increase of 0.7% from $818.9 million for 2014, which increased 1.7% from $805.6 million for 2013. The increases
in both periods were primarily driven by higher average loan and lease balances in the auto finance, leasing and
equipment finance and inventory finance businesses. These increases were partially offset by margin reduction resulting
from the competitive, low interest rate environment. The increase in 2014 was also due to the reduced cost of borrowings.
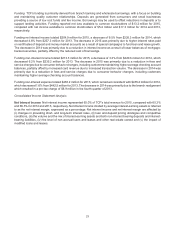
Net interest margin was 4.42% for 2015, compared with 4.61% and 4.68% for 2014 and 2013, respectively. The
decrease in 2015 was primarily due to margin compression resulting from the competitive, low interest rate environment
and higher rates on certificates of deposit and money market accounts, as well as a change in the asset portfolio mix
due to growth in the auto finance business. The decrease in 2014 was primarily due to continued margin reduction
resulting from the ongoing competitive low interest rate environment and change in the asset portfolio mix due to
growth in the auto finance business.