TCF Bank 2015 Annual Report Download - page 43
Download and view the complete annual report
Please find page 43 of the 2015 TCF Bank annual report below. You can navigate through the pages in the report by either clicking on the pages listed below, or by using the keyword search tool below to find specific information within the annual report.-
 1
1 -
2
-
3
-
4
-
5
-
6
-
7
-
8
-
9
-
10
-
11
-
12
-
13
-
14
-
15
-
16
-
17
-
18
-
19
-
20
-
21
-
22
-
23
-
24
-
25
-
26
-
27
-
28
-
29
-
30
-
31
-
32
-
 33
33 -
 34
34 -
 35
35 -
 36
36 -
 37
37 -
 38
38 -
 39
39 -
 40
40 -
 41
41 -
 42
42 -
 43
43 -
 44
44 -
 45
45 -
 46
46 -
 47
47 -
 48
48 -
 49
49 -
 50
50 -
 51
51 -
 52
52 -
 53
53 -
54
-
55
-
56
-
57
-
58
-
59
-
60
-
61
-
62
-
63
-
64
-
65
-
66
-
67
-
68
-
69
-
70
-
71
-
72
-
73
-
74
-
75
-
76
-
77
-
78
-
79
-
80
-
81
-
82
-
83
-
84
-
85
-
86
-
87
-
88
-
89
-
90
-
91
-
92
-
93
-
94
-
95
-
96
-
97
-
98
-
99
-
100
-
101
-
102
-
103
-
104
-
105
-
106
-
107
-
108
-
109
-
110
-
111
-
112
-
113
-
114
-
115
-
116
-
117
-
118
-
119
-
120
-
121
-
122
-
123
-
124
-
125
-
126
-
127
-
128
-
129
-
130
-
131
-
132
-
133
-
134
-
135
-
136
-
137
-
138
-
139
-
140
-
141
-
142
-
143
-
144
 |
 |

28
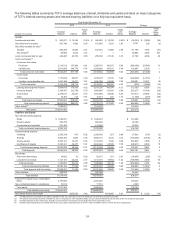
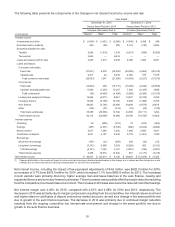
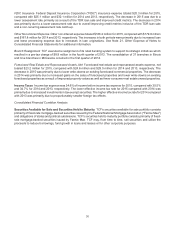
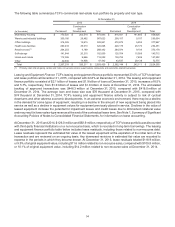
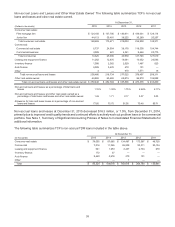
Non-interest Income Non-interest income is a significant source of revenue for TCF, representing 35.0% of total
revenue for 2015, compared with 34.7% and 33.5% for 2014 and 2013, respectively, and is an important factor in
TCF's results of operations. Total fees and other revenue were $442.3 million for 2015, compared with $432.2 million
and $403.1 million for 2014 and 2013, respectively.
Compound Annual
Year Ended December 31, Growth Rate
1-Year 5-Year
(Dollars in thousands) 2015 2014 2013 2012 2011 2015/2014 2015/2010
Fees and service charges $ 144,999 $ 154,386 $ 166,606 $ 177,953 $ 219,363 (6.1)% (11.9)%
Card revenue 54,387 51,323 51,920 52,638 96,147 6.0 (13.3)
ATM revenue 21,544 22,225 22,656 24,181 27,927 (3.1) (6.3)
Subtotal 220,930 227,934 241,182 254,772 343,437 (3.1) (11.8)
Gains on sales of auto loans, net 30,580 43,565 29,699 22,101 1,133 (29.8) N.M.
Gains on sales of consumer real
estate loans, net 40,964 34,794 21,692 5,413 —17.7 N.M.
Servicing fee income 31,229 21,444 13,406 7,759 970 45.6 N.M.
Subtotal 102,773 99,803 64,797 35,273 2,103 3.0 N.M.
Leasing and equipment finance 108,129 93,799 90,919 92,172 89,167 15.3 3.9
Other 10,463 10,704 6,196 5,974 2,464 (2.3) 13.4
Fees and other revenue 442,295 432,240 403,094 388,191 437,171 2.3 (2.8)
Gains (losses) on securities, net (297) 1,027 964 102,232 7,263 N.M. N.M.
Total non-interest income $ 441,998 $ 433,267 $ 404,058 $ 490,423 $ 444,434 2.0 (3.9)
Total non-interest income as a
percentage of total revenue 35.0% 34.7% 33.5%38.6%38.8%
N.M. Not Meaningful.
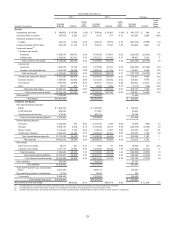
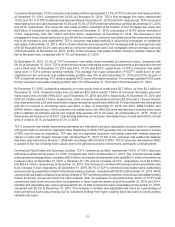
Fees and Service Charges Fees and service charges totaled $145.0 million for 2015, compared with $154.4 million
and $166.6 million for 2014 and 2013, respectively. Fees and service charges represented 65.6% of banking fee
revenue for 2015, compared with 67.7% and 69.1% for 2014 and 2013, respectively. The decreases in both periods
were primarily due to consumer behavior changes, including customers maintaining higher average checking account
balances.
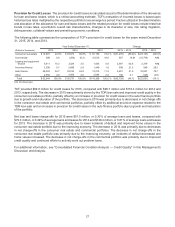
Card Revenue Card revenue, primarily interchange fees charged to retailers, totaled $54.4 million for 2015, compared
with $51.3 million and $51.9 million for 2014 and 2013, respectively. Card revenue represented 24.6% of banking fee
revenue for 2015, compared with 22.5% and 21.5% for 2014 and 2013, respectively. The increase in 2015 was primarily
due to increased transaction volume. The decrease in 2014 was primarily due to fewer checking accounts with debit
cards. TCF is the 17th largest issuer of Visa® consumer debit cards and the 17th largest issuer of Visa small business
debit cards in the United States, based on payment volume for the three months ended September 30, 2015, as
provided by Visa.
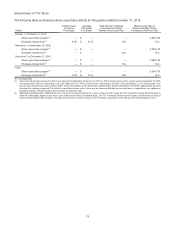
Gains on Sales of Auto Loans, Net In 2015, TCF recognized net gains of $32.2 million, excluding subsequent
adjustments, on the recorded investment of $1.4 billion in auto loans sold, including accrued interest. In 2014, TCF
recognized net gains of $44.7 million, excluding subsequent adjustments, on the recorded investment of $1.3 billion
in auto loans sold, including accrued interest. In 2013, TCF recognized net gains of $29.7 million on the recorded
investment of $798.3 million in auto loans sold, including accrued interest. The decrease in net gains in 2015 was
primarily due to a stronger competitive environment and an increase in transaction costs, partially offset by an increase
in auto loans sold primarily due to the continued growth of the auto finance business as TCF continues to sell a
percentage of its originations each quarter. Included in the net gains on sales of auto loans are amounts related to the
execution of securitizations. During 2015 and 2014, TCF transferred the recorded investments of $1.1 billion and
$258.6 million, respectively, in consumer auto loans, including accrued interest, with servicing retained, to trusts in
securitization transactions, and recognized gains of $25.5 million and $7.4 million, respectively, excluding subsequent
adjustments. There were no securitization transactions in 2013. See Note 5, Loans and Leases of Notes to Consolidated
Financial Statements for additional information.