TCF Bank 2015 Annual Report Download - page 83
Download and view the complete annual report
Please find page 83 of the 2015 TCF Bank annual report below. You can navigate through the pages in the report by either clicking on the pages listed below, or by using the keyword search tool below to find specific information within the annual report.-
 1
1 -
2
-
3
-
4
-
5
-
6
-
7
-
8
-
9
-
10
-
11
-
12
-
13
-
14
-
15
-
16
-
17
-
18
-
19
-
20
-
21
-
22
-
23
-
24
-
25
-
26
-
27
-
28
-
29
-
30
-
31
-
32
-
33
-
34
-
35
-
36
-
37
-
38
-
39
-
40
-
41
-
42
-
43
-
44
-
45
-
46
-
47
-
48
-
49
-
50
-
51
-
52
-
53
-
54
-
55
-
56
-
57
-
58
-
59
-
60
-
61
-
62
-
63
-
64
-
65
-
66
-
67
-
68
-
69
-
70
-
71
-
72
-
 73
73 -
 74
74 -
 75
75 -
 76
76 -
 77
77 -
 78
78 -
 79
79 -
 80
80 -
 81
81 -
 82
82 -
 83
83 -
 84
84 -
 85
85 -
 86
86 -
 87
87 -
 88
88 -
 89
89 -
 90
90 -
 91
91 -
 92
92 -
 93
93 -
94
-
95
-
96
-
97
-
98
-
99
-
100
-
101
-
102
-
103
-
104
-
105
-
106
-
107
-
108
-
109
-
110
-
111
-
112
-
113
-
114
-
115
-
116
-
117
-
118
-
119
-
120
-
121
-
122
-
123
-
124
-
125
-
126
-
127
-
128
-
129
-
130
-
131
-
132
-
133
-
134
-
135
-
136
-
137
-
138
-
139
-
140
-
141
-
142
-
143
-
144
 |
 |

68
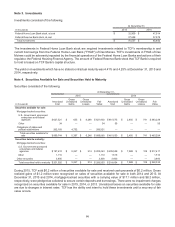
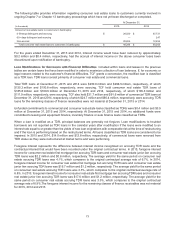
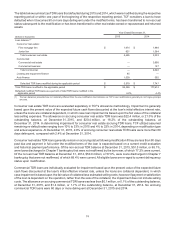
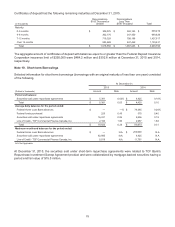
The amortized cost and fair value of securities available for sale and securities held to maturity by final contractual
maturity at December 31, 2015 and 2014 are shown below. The remaining contractual principal maturities do not
consider possible prepayments. Remaining expected maturities will differ from contractual maturities because
borrowers may have the right to prepay.
At December 31,
2015 2014
(In thousands) Amortized Cost Fair Value Amortized Cost Fair Value
Securities available for sale:
Due in one year or less $ 1 $ 1 $ 4$4
Due in 1-5 years 38 38 76 76
Due in 5-10 years 268,638 272,511 86,806 87,594
Due after 10 years 621,067 616,335 374,744 375,620
Total securities available for sale $ 889,744 $ 888,885 $ 461,630 $463,294
Securities held to maturity:
Due in one year or less $ 100 $100 $500 $500
Due in 1-5 years 1,900 1,900 2,500 2,500
Due in 5-10 years 1,400 1,400 400 400
Due after 10 years 198,520 203,553 211,054 218,933
Total securities held to maturity $ 201,920 $ 206,953 $ 214,454 $222,333
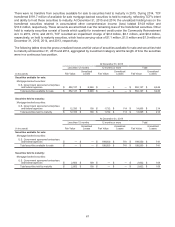
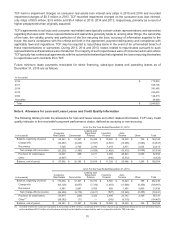
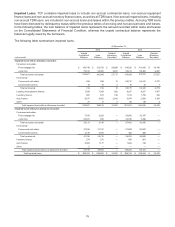
Note 5. Loans and Leases
Loans and leases consisted of the following.
At December 31,
(Dollars in thousands) 2015 2014 Percent Change
Consumer real estate:
First mortgage lien $ 2,624,956 $3,139,152 (16.4)%
Junior lien 2,839,316 2,543,212 11.6
Total consumer real estate 5,464,272 5,682,364 (3.8)
Commercial:
Commercial real estate:
Permanent 2,267,218 2,382,144 (4.8)
Construction and development 326,211 242,111 34.7
Total commercial real estate 2,593,429 2,624,255 (1.2)
Commercial business 552,403 533,410 3.6
Total commercial 3,145,832 3,157,665 (0.4)
Leasing and equipment finance 4,012,248 3,745,322 7.1
Inventory finance 2,146,754 1,877,090 14.4
Auto finance 2,647,596 1,915,061 38.3
Other 19,297 24,144 (20.1)
Total loans and leases(1) $17,435,999 $16,401,646 6.3
(1) Loans and leases are reported at historical cost including net direct fees and costs associated with originating and acquiring loans and leases, lease residuals,
unearned income and unamortized purchase premiums and discounts. The aggregate amount of these loan and lease adjustments was $56.1 million and
$43.4 million at December 31, 2015 and 2014, respectively.