TCF Bank 2015 Annual Report Download - page 53
Download and view the complete annual report
Please find page 53 of the 2015 TCF Bank annual report below. You can navigate through the pages in the report by either clicking on the pages listed below, or by using the keyword search tool below to find specific information within the annual report.
38
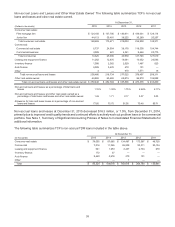
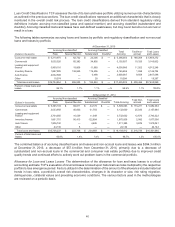
Non-accrual Loans and Leases and Other Real Estate Owned The following table summarizes TCF's non-accrual
loans and leases and other real estate owned.
At December 31,
(Dollars in thousands) 2015 2014 2013 2012 2011
Consumer real estate:
First mortgage lien $ 124,156 $ 137,790 $ 180,811 $ 199,631 $ 129,114
Junior lien 44,113 35,481 38,222 35,269 20,257
Total consumer real estate 168,269 173,271 219,033 234,900 149,371
Commercial:
Commercial real estate 6,737 24,554 36,178 118,300 104,744
Commercial business 3,588 481 4,361 9,446 22,775
Total commercial 10,325 25,035 40,539 127,746 127,519
Leasing and equipment finance 11,262 12,670 14,041 13,652 20,583
Inventory finance 1,098 2,082 2,529 1,487 823
Auto finance 9,509 3,676 470 101 —
Other 3 — 410 1,571 15
Total non-accrual loans and leases 200,466 216,734 277,022 379,457 298,311
Other real estate owned 49,982 65,650 68,874 96,978 134,898
Total non-accrual loans and leases and other real estate owned $ 250,448 $ 282,384 $ 345,896 $ 476,435 $ 433,209
Non-accrual loans and leases as a percentage of total loans and
leases 1.15%1.32%1.75%2.46%2.11%
Non-accrual loans and leases and other real estate owned as a
percentage of total loans and leases and other real estate owned 1.43 1.71 2.17 3.07 3.03
Allowance for loan and lease losses as a percentage of non-accrual
loans and leases 77.85 75.75 91.05 70.40 85.71
Non-accrual loans and leases at December 31, 2015 decreased $16.3 million, or 7.5%, from December 31, 2014,
primarily due to improved credit quality trends and continued efforts to actively work out problem loans in the commercial
portfolio. See Note 1, Summary of Significant Accounting Policies of Notes to Consolidated Financial Statements for
additional information.
The following table summarizes TCF's non-accrual TDR loans included in the table above.
At December 31,
(In thousands) 2015 2014 2013 2012 2011
Consumer real estate $ 79,055 $87,685 $ 134,487 $ 173,587 $46,728
Commercial 7,016 11,265 26,209 92,311 83,154
Leasing and equipment finance 641 1,953 2,447 2,794 979
Inventory finance 172 37 — — —
Auto finance 8,440 3,676 470 101 —
Other — — 1 — —
Total $ 95,324 $ 104,616 $ 163,614 $ 268,793 $130,861


