TCF Bank 2015 Annual Report Download - page 74
Download and view the complete annual report
Please find page 74 of the 2015 TCF Bank annual report below. You can navigate through the pages in the report by either clicking on the pages listed below, or by using the keyword search tool below to find specific information within the annual report.-
 1
1 -
2
-
3
-
4
-
5
-
6
-
7
-
8
-
9
-
10
-
11
-
12
-
13
-
14
-
15
-
16
-
17
-
18
-
19
-
20
-
21
-
22
-
23
-
24
-
25
-
26
-
27
-
28
-
29
-
30
-
31
-
32
-
33
-
34
-
35
-
36
-
37
-
38
-
39
-
40
-
41
-
42
-
43
-
44
-
45
-
46
-
47
-
48
-
49
-
50
-
51
-
52
-
53
-
54
-
55
-
56
-
57
-
58
-
59
-
60
-
61
-
62
-
63
-
 64
64 -
 65
65 -
 66
66 -
 67
67 -
 68
68 -
 69
69 -
 70
70 -
 71
71 -
 72
72 -
 73
73 -
 74
74 -
 75
75 -
 76
76 -
 77
77 -
 78
78 -
 79
79 -
 80
80 -
 81
81 -
 82
82 -
 83
83 -
 84
84 -
85
-
86
-
87
-
88
-
89
-
90
-
91
-
92
-
93
-
94
-
95
-
96
-
97
-
98
-
99
-
100
-
101
-
102
-
103
-
104
-
105
-
106
-
107
-
108
-
109
-
110
-
111
-
112
-
113
-
114
-
115
-
116
-
117
-
118
-
119
-
120
-
121
-
122
-
123
-
124
-
125
-
126
-
127
-
128
-
129
-
130
-
131
-
132
-
133
-
134
-
135
-
136
-
137
-
138
-
139
-
140
-
141
-
142
-
143
-
144
 |
 |

59
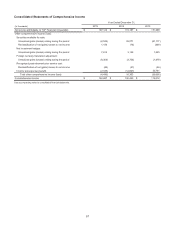
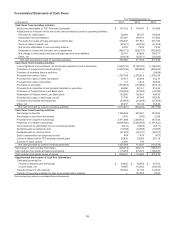
Consolidated Statements of Cash Flows
Year Ended December 31,
(In thousands) 2015 2014 2013
Cash flows from operating activities:
Net income attributable to TCF Financial Corporation $ 197,123 $ 174,187 $151,668
Adjustments to reconcile net income to net cash provided by (used in) operating activities:
Provision for credit losses 52,944 95,737 118,368
Depreciation and amortization 157,287 128,701 117,950
Proceeds from sales of loans and leases held for sale 970,467 571,551 277,180
Gains on sales of assets, net (80,471) (90,736) (61,265)
Net income attributable to non-controlling interest 8,700 7,429 7,032
Originations of loans held for sale, net of repayments (965,712)(626,172)(353,982)
Net change in other assets and accrued expenses and other liabilities 52,761 83,624 190,371
Other, net (29,439) (32,571) (36,288)
Net cash provided by (used in) operating activities 363,660 311,750 411,034
Cash flows from investing activities:
Loan originations and purchases, net of principal collected on loans and leases (1,968,134)(2,190,753)(1,196,030)
Purchases of equipment for lease financing (1,087,438)(920,985)(904,383)
Purchase of inventory finance portfolios — — (9,658)
Proceeds from sales of loans 1,767,785 2,278,812 1,378,235
Proceeds from sales of lease receivables 27,817 25,468 43,215
Proceeds from sales of securities 177 2,813 46,506
Purchases of securities (510,675)(139,080) (53,312)
Proceeds from maturities of and principal collected on securities 94,250 58,151 91,424
Purchases of Federal Home Loan Bank stock (138,000) (97,000) (18,789)
Redemption of Federal Home Loan Bank stock 153,005 105,931 40,976
Proceeds from sales of real estate owned 71,709 67,049 102,250
Purchases of premises and equipment (53,594) (45,469) (37,859)
Other, net 26,457 30,140 35,636
Net cash provided by (used in) investing activities (1,616,641)(824,923)(481,789)
Cash flows from financing activities:
Net change in deposits 1,256,646 997,661 370,356
Net change in short-term borrowings 1,072 (493)2,299
Proceeds from long-term borrowings 4,471,086 2,808,612 744,348
Payments on long-term borrowings (4,666,595)(3,059,948)(1,191,422)
Net investment by (distribution to) non-controlling interest (6,414) (5,505)(8,511)
Dividends paid on preferred stock (19,388) (19,388) (19,065)
Dividends paid on common stock (37,302) (32,731) (32,227)
Stock compensation tax (expense) benefit 558 1,316 (473)
Common shares sold to TCF employee benefit plans 24,835 23,083 20,179
Exercise of stock options 2,570 740 —
Net cash provided by (used in) financing activities 1,027,068 713,347 (114,516)
Net change in cash and due from banks (225,913)200,174 (185,271)
Cash and due from banks at beginning of period 1,115,250 915,076 1,100,347
Cash and due from banks at end of period $ 889,337 $ 1,115,250 $915,076
Supplemental disclosures of cash flow information:
Cash paid (received) for:
Interest on deposits and borrowings $ 64,855 $55,954 $61,453
Income taxes, net 79,687 113,562 (28,456)
Transfer of loans to other assets 107,403 91,180 112,463
Transfer of securities available for sale to securities held to maturity — 191,665 9,342
See accompanying notes to consolidated financial statements.