TCF Bank 2015 Annual Report Download - page 39
Download and view the complete annual report
Please find page 39 of the 2015 TCF Bank annual report below. You can navigate through the pages in the report by either clicking on the pages listed below, or by using the keyword search tool below to find specific information within the annual report.-
 1
1 -
2
-
3
-
4
-
5
-
6
-
7
-
8
-
9
-
10
-
11
-
12
-
13
-
14
-
15
-
16
-
17
-
18
-
19
-
20
-
21
-
22
-
23
-
24
-
25
-
26
-
27
-
28
-
 29
29 -
 30
30 -
 31
31 -
 32
32 -
 33
33 -
 34
34 -
 35
35 -
 36
36 -
 37
37 -
 38
38 -
 39
39 -
 40
40 -
 41
41 -
 42
42 -
 43
43 -
 44
44 -
 45
45 -
 46
46 -
 47
47 -
 48
48 -
 49
49 -
50
-
51
-
52
-
53
-
54
-
55
-
56
-
57
-
58
-
59
-
60
-
61
-
62
-
63
-
64
-
65
-
66
-
67
-
68
-
69
-
70
-
71
-
72
-
73
-
74
-
75
-
76
-
77
-
78
-
79
-
80
-
81
-
82
-
83
-
84
-
85
-
86
-
87
-
88
-
89
-
90
-
91
-
92
-
93
-
94
-
95
-
96
-
97
-
98
-
99
-
100
-
101
-
102
-
103
-
104
-
105
-
106
-
107
-
108
-
109
-
110
-
111
-
112
-
113
-
114
-
115
-
116
-
117
-
118
-
119
-
120
-
121
-
122
-
123
-
124
-
125
-
126
-
127
-
128
-
129
-
130
-
131
-
132
-
133
-
134
-
135
-
136
-
137
-
138
-
139
-
140
-
141
-
142
-
143
-
144
 |
 |
24
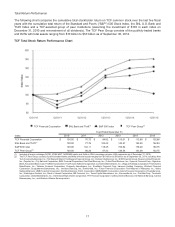
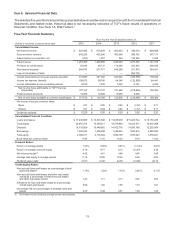
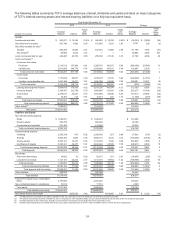
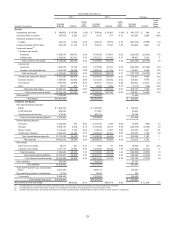
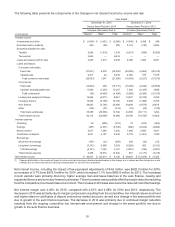
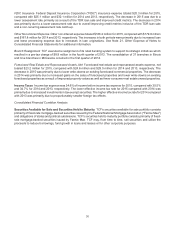
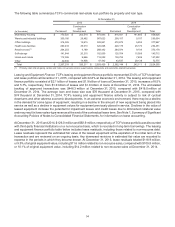
The following tables summarize TCF's average balances, interest, dividends and yields and rates on major categories
of TCF's interest-earning assets and interest-bearing liabilities on a fully tax-equivalent basis.
Year Ended December 31,
2015 2014 Change
(Dollars in thousands) Average
Balance Interest
Yields
and
Rates Average
Balance Interest
Yields
and
Rates Average
Balance Interest
Yields
and
Rates
(bps)
Assets:
Investments and other $ 520,577 $ 12,294 2.36% $ 586,803 $ 15,390 2.62% $ (66,226) $ (3,096) (26)
Securities held to maturity 207,140 5,486 2.65 197,943 5,281 2.67 9,197 205 (2)
Securities available for sale:(1)
Taxable 564,205 13,930 2.47 447,016 11,994 2.68 117,189 1,936 (21)
Tax-exempt(2) 80,894 2,643 3.27 — — — 80,894 2,643 327
Loans and leases held for sale 286,295 25,766 9.00 259,186 21,128 8.15 27,109 4,638 85
Loans and leases:(3)
Consumer real estate:
Fixed-rate 2,710,512 157,428 5.81 3,359,670 190,973 5.68 (649,158) (33,545) 13
Variable-rate 2,911,689 149,770 5.14 2,788,882 143,431 5.14 122,807 6,339 —
Total consumer real estate 5,622,201 307,198 5.46 6,148,552 334,404 5.44 (526,351) (27,206) 2
Commercial:
Fixed-rate 1,173,039 59,037 5.03 1,469,579 73,752 5.02 (296,540) (14,715) 1
Variable- and adjustable-rate 1,961,389 76,677 3.91 1,665,788 66,450 3.99 295,601 10,227 (8)
Total commercial 3,134,428 135,714 4.33 3,135,367 140,202 4.47 (939)(4,488) (14)
Leasing and equipment finance 3,804,015 175,565 4.62 3,531,256 166,974 4.73 272,759 8,591 (11)
Inventory finance 2,154,357 122,799 5.70 1,888,080 112,603 5.96 266,277 10,196 (26)
Auto finance 2,278,617 94,463 4.15 1,567,904 68,595 4.37 710,713 25,868 (22)
Other 10,303 712 6.91 12,071 931 7.71 (1,768)(219) (80)
Total loans and leases 17,003,921 836,451 4.92 16,283,230 823,709 5.06 720,691 12,742 (14)
Total interest-earning assets 18,663,032 896,570 4.80 17,774,178 877,502 4.94 888,854 19,068 (14)
Other assets(4) 1,228,651 1,124,226 104,425
Total assets $19,891,683 $18,898,404 $ 993,279
Liabilities and Equity:
Non-interest bearing deposits:
Retail $ 1,658,951 $ 1,546,453 $ 112,498
Small business 838,758 806,649 32,109
Commercial and custodial 507,446 413,893 93,553
Total non-interest bearing deposits 3,005,155 2,766,995 238,160
Interest-bearing deposits:
Checking 2,396,334 547 0.02 2,328,402 921 0.04 67,932 (374) (2)
Savings 4,938,303 3,005 0.06 5,693,751 8,343 0.15 (755,448) (5,338) (9)
Money market 2,265,121 14,237 0.63 1,312,483 7,032 0.54 952,638 7,205 9
Certificates of deposit 3,340,341 30,437 0.91 2,840,922 22,089 0.78 499,419 8,348 13
Total interest-bearing deposits 12,940,099 48,226 0.37 12,175,558 38,385 0.32 764,541 9,841 5
Total deposits 15,945,254 48,226 0.30 14,942,553 38,385 0.26 1,002,701 9,841 4
Borrowings:
Short-term borrowings 18,822 53 0.28 83,673 261 0.31 (64,851) (208) (3)
Long-term borrowings 1,121,181 23,263 2.07 1,311,176 19,954 1.52 (189,995) 3,309 55
Total borrowings 1,140,003 23,316 2.05 1,394,849 20,215 1.45 (254,846) 3,101 60
Total interest-bearing liabilities 14,080,102 71,542 0.51 13,570,407 58,600 0.43 509,695 12,942 8
Total deposits and borrowings 17,085,257 71,542 0.42 16,337,402 58,600 0.36 747,855 12,942 6
Other liabilities 589,222 502,560 86,662
Total liabilities 17,674,479 16,839,962 834,517
Total TCF Financial Corp. stockholders'
equity 2,197,690 2,041,428 156,262
Non-controlling interest in subsidiaries 19,514 17,014 2,500
Total equity 2,217,204 2,058,442 158,762
Total liabilities and equity $19,891,683 $18,898,404 $ 993,279
Net interest income and margin $825,028 4.42 $818,902 4.61 $ 6,126 (19)
(1) Average balances and yields of securities available for sale are based upon historical amortized cost and exclude equity securities.
(2) The yield on tax-exempt securities available for sale is computed on a tax-equivalent basis using a statutory federal income tax rate of 35% for all periods presented.
(3) Average balances of loans and leases include non-accrual loans and leases and are presented net of unearned income.
(4) Includes leased equipment and related initial direct costs under operating leases of $104.1 million and $84.9 million in 2015 and 2014, respectively.