Foot Locker 2005 Annual Report Download - page 40
Download and view the complete annual report
Please find page 40 of the 2005 Foot Locker annual report below. You can navigate through the pages in the report by either clicking on the pages listed below, or by using the keyword search tool below to find specific information within the annual report.-
 1
1 -
2
-
3
-
4
-
5
-
6
-
7
-
8
-
9
-
10
-
11
-
12
-
13
-
14
-
15
-
16
-
17
-
18
-
19
-
20
-
21
-
22
-
23
-
24
-
25
-
26
-
27
-
28
-
29
-
 30
30 -
 31
31 -
 32
32 -
 33
33 -
 34
34 -
 35
35 -
 36
36 -
 37
37 -
 38
38 -
 39
39 -
 40
40 -
 41
41 -
 42
42 -
 43
43 -
 44
44 -
 45
45 -
 46
46 -
 47
47 -
 48
48 -
 49
49 -
 50
50 -
51
-
52
-
53
-
54
-
55
-
56
-
57
-
58
-
59
-
60
-
61
-
62
-
63
-
64
-
65
-
66
-
67
-
68
-
69
-
70
-
71
-
72
-
73
-
74
-
75
-
76
-
77
-
78
-
79
-
80
-
81
-
82
-
83
-
84
-
85
-
86
-
87
-
88
-
89
-
90
-
91
-
92
-
93
-
94
-
95
-
96
-
97
-
98
-
99
-
100
-
101
-
102
-
103
-
104
-
105
-
106
-
107
-
108
-
109
-
110
-
111
-
112
-
113
-
114
-
115
-
116
-
117
-
118
-
119
-
120
-
121
-
122
-
123
-
124
-
125
-
126
-
127
-
128
-
129
-
130
-
131
-
132
-
133
 |
 |

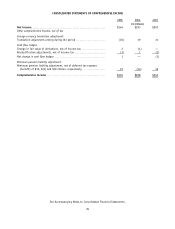
CONSOLIDATED STATEMENTS OF OPERATIONS
2005 2004 2003
(in millions, except per
share amounts)
Sales ..................................................................... $5,653 $5,355 $4,779
Costs and expenses
Cost of sales .............................................................. 3,944 3,722 3,297
Selling, general and administrative expenses ............................. 1,129 1,088 987
Depreciation and amortization ............................................ 171 154 152
Restructuring charges..................................................... — 2 1
Interest expense, net ..................................................... 10 15 18
5,254 4,981 4,455
Other income ............................................................. (6) — —
5,248 4,981 4,455
Income from continuing operations before income taxes.................. 405 374 324
Income tax expense....................................................... 142 119 115
Income from continuing operations .................................... 263 255 209
Income (loss) on disposal of discontinued operations,
net of income tax benefit of $3, $37, and $4, respectively ............. 1 38 (1)
Cumulative effect of accounting change,
net of income tax benefit of $ — ...................................... — — (1)
Net income .............................................................. $ 264 $ 293 $ 207
Basic earnings per share:
Income from continuing operations .................................... $ 1.70 $ 1.69 $ 1.47
Income (loss) from discontinued operations............................ 0.01 0.25 (0.01)
Cumulative effect of accounting change ................................ — — —
Net income............................................................. $ 1.71 $ 1.94 $ 1.46
Diluted earnings per share:
Income from continuing operations .................................... $ 1.67 $ 1.64 $ 1.40
Income (loss) from discontinued operations............................ 0.01 0.24 (0.01)
Cumulative effect of accounting change ................................ — — —
Net income............................................................. $ 1.68 $ 1.88 $ 1.39
See Accompanying Notes to Consolidated Financial Statements.
24