Foot Locker 2005 Annual Report Download - page 27
Download and view the complete annual report
Please find page 27 of the 2005 Foot Locker annual report below. You can navigate through the pages in the report by either clicking on the pages listed below, or by using the keyword search tool below to find specific information within the annual report.-
 1
1 -
2
-
3
-
4
-
5
-
6
-
7
-
8
-
9
-
10
-
11
-
12
-
13
-
14
-
15
-
16
-
 17
17 -
 18
18 -
 19
19 -
 20
20 -
 21
21 -
 22
22 -
 23
23 -
 24
24 -
 25
25 -
 26
26 -
 27
27 -
 28
28 -
 29
29 -
 30
30 -
 31
31 -
 32
32 -
 33
33 -
 34
34 -
 35
35 -
 36
36 -
 37
37 -
38
-
39
-
40
-
41
-
42
-
43
-
44
-
45
-
46
-
47
-
48
-
49
-
50
-
51
-
52
-
53
-
54
-
55
-
56
-
57
-
58
-
59
-
60
-
61
-
62
-
63
-
64
-
65
-
66
-
67
-
68
-
69
-
70
-
71
-
72
-
73
-
74
-
75
-
76
-
77
-
78
-
79
-
80
-
81
-
82
-
83
-
84
-
85
-
86
-
87
-
88
-
89
-
90
-
91
-
92
-
93
-
94
-
95
-
96
-
97
-
98
-
99
-
100
-
101
-
102
-
103
-
104
-
105
-
106
-
107
-
108
-
109
-
110
-
111
-
112
-
113
-
114
-
115
-
116
-
117
-
118
-
119
-
120
-
121
-
122
-
123
-
124
-
125
-
126
-
127
-
128
-
129
-
130
-
131
-
132
-
133
 |
 |

the rate increased due to a shift in taxable income from lower to higher tax jurisdictions. During 2003, the Company
recorded a $1 million tax benefit related to state tax law changes, a $2 million tax benefit related to a reduction in the
valuation allowance for deferred tax assets related to a multi-state tax planning strategy, a $1 million tax benefit related
to a reduction in the valuation allowance for foreign tax loss carryforwards, and a tax benefit of $1 million related to the
settlement of tax examinations.
Segment Information
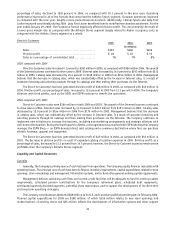
Athletic Stores 2005 2004 2003
(in millions)
Sales....................................................................... $5,272 $4,989 $4,413
Division profit ............................................................. $ 419 $ 420 $ 363
Sales as a percentage of consolidated total ................................ 93% 93% 92%
Number of stores at year end .............................................. 3,921 3,967 3,610
Selling square footage (in millions) ........................................ 8.71 8.89 7.92
Gross square footage (in millions) ......................................... 14.48 14.78 13.14
2005 compared with 2004
Athletic Stores sales of $5,272 million increased 5.7 percent in 2005, as compared with $4,989 million in 2004.
Excluding the effect of foreign currency fluctuations, primarily related to the euro, sales from athletic store formats
increased 5.5 percent in 2005. Comparable-store sales increased by 2.6 percent in 2005. These increases were primarily
driven by sales related to the Footaction division, which was acquired in May 2004. Approximately $126 million of the
increase in Footaction represented the inclusion of their operations for the full year in 2005. Champs Sports experienced
a strong increase in sales during 2005, as this format benefited from higher quantities of marquee athletic footwear and
private label apparel. Foot Locker Canada also experienced increased sales. Excluding the effect of foreign currency
fluctuations, Foot Locker Europe’s sales were essentially flat as compared with the corresponding prior year period.
Division profit from Athletic Stores decreased by 0.2 percent to $419 million in 2005 from $420 million in 2004.
Division profit, as a percentage of sales, decreased to 7.9 percent in 2005 from 8.4 percent in 2004. This decline is primarily
a result of the decreased profit from the European operations as compared with the prior year. The continued weak
economy, the increased competitive environment and a fashion shift from higher priced marquee footwear to lower priced
low profile footwear negatively affected Europe’s operating results. In addition during 2005, Foot Locker Europe recorded
significantly higher markdowns as a result of the continued promotional environment, particularly in the U.K. and France,
and to clear excess inventory. Despite these factors, in 2005 Foot Locker Europe achieved a double-digit division profit
margin. Management is currently implementing various merchandising and management initiatives identified during the
third and fourth quarters of 2005, in order to address both the internal and external factors that negatively affected the
current year results. Management will continue to monitor the progress of the European operations and will assess, if
necessary, the impact of these initiatives on the projected performance of the division, which may include an analysis
of recoverability of store long-lived assets pursuant to SFAS No. 144. Management expects the trend toward lower priced
low profile footwear and the competitive environment to continue during 2006. The decline noted in Europe was partially
offset by the improved results at the Footaction, Champs Sports and the Canadian divisions. The increase in Footaction
is primarily a result of the inclusion of their results for the full year as compared with a partial year during 2004. Champs
Sports continues to be one of our most profitable divisions.
2004 compared with 2003
Athletic Stores sales of $4,989 million increased 13.1 percent in 2004, as compared with $4,413 million in 2003.
Excluding the effect of foreign currency fluctuations, primarily related to the euro, sales from athletic store formats increased
10.6 percent in 2004. This increase was primarily driven by incremental sales related to the acquisition of the 349 Footaction
stores in May 2004 totaling $332 million and the sales of the 11 stores acquired in the Republic of Ireland amounting to
$5 million. The balance of the increase primarily reflects new store growth. Total Athletic Stores comparable-store sales
increased by 1.0 percent in 2004. The Company benefited from continued exclusive offerings from its primary suppliers,
gaining access to greater amounts of marquee products, and a developing trend towards higher priced technical footwear.
Division profit from Athletic Stores increased by 15.7 percent to $420 million in 2004 from $363 million in 2003.
Division profit, as a percentage of sales, increased to 8.4 percent in 2004 from 8.2 percent in 2003. The increase in 2004
was primarily driven by the overall improvement in the SG&A rate as a result of better expense control. SG&A, as a
11