Foot Locker 2005 Annual Report Download - page 4
Download and view the complete annual report
Please find page 4 of the 2005 Foot Locker annual report below. You can navigate through the pages in the report by either clicking on the pages listed below, or by using the keyword search tool below to find specific information within the annual report.-
 1
1 -
 2
2 -
 3
3 -
 4
4 -
 5
5 -
 6
6 -
 7
7 -
 8
8 -
 9
9 -
 10
10 -
 11
11 -
 12
12 -
 13
13 -
 14
14 -
 15
15 -
16
-
17
-
18
-
19
-
20
-
21
-
22
-
23
-
24
-
25
-
26
-
27
-
28
-
29
-
30
-
31
-
32
-
33
-
34
-
35
-
36
-
37
-
38
-
39
-
40
-
41
-
42
-
43
-
44
-
45
-
46
-
47
-
48
-
49
-
50
-
51
-
52
-
53
-
54
-
55
-
56
-
57
-
58
-
59
-
60
-
61
-
62
-
63
-
64
-
65
-
66
-
67
-
68
-
69
-
70
-
71
-
72
-
73
-
74
-
75
-
76
-
77
-
78
-
79
-
80
-
81
-
82
-
83
-
84
-
85
-
86
-
87
-
88
-
89
-
90
-
91
-
92
-
93
-
94
-
95
-
96
-
97
-
98
-
99
-
100
-
101
-
102
-
103
-
104
-
105
-
106
-
107
-
108
-
109
-
110
-
111
-
112
-
113
-
114
-
115
-
116
-
117
-
118
-
119
-
120
-
121
-
122
-
123
-
124
-
125
-
126
-
127
-
128
-
129
-
130
-
131
-
132
-
133
 |
 |

SHAREHOLDERS’LETTER
For Foot Locker, Inc., 2005 was a year of
accomplishments, both in positioning our
Company to generate greater value for
shareholders, and in aggressively address-
ing new opportunities and challenges
alike. For the most part we produced cred-
itable results during the past year, but fell
short of the earnings target we set for
ourselves at the beginning of the year.
In brief, our performance in certain
international markets, primarily in Europe,
did not meet our expectations. We have
since moved quickly to address several
internal and external factors that con-
tributed to profit declines in these mar-
kets. To continue our success as a global
specialty retailer, we must anticipate
worldwide consumer trends and meet or
exceed the needs of our customers.
Towards this end, we are working actively
with our suppliers to better assure that we
provide to our customers, wherever they
reside, the most fashionable, highest
quality products at compelling and com-
petitive prices.
On a more positive note, we are
pleased with the solid sales and profit
gains posted by our combined North
American retail store business and direct-
to-customers operations. Our Champs
Sports and recently-acquired Footaction
businesses were our star performers for
the year, while our Footlocker.com/
Eastbay direct-to-customers business
posted our highest division profit margin
rate.
Not to be overlooked in 2005 were the
steps we continued to take to improve our
financial footing: We further strengthened
our balance sheet by reducing our finan-
cial liabilities, while also significantly
increasing the amount of cash that we
returned to our shareholders through div-
idends and a share repurchase program.
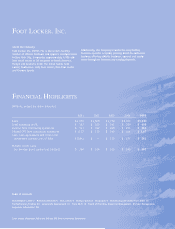
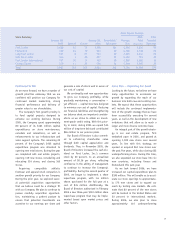
2005 Financial Scoreboard
Overall, our business produced solid sales
and pre-tax earnings increases while also
generating strong cash flow that we are
actively redeploying to benefit our share-
holders.
The following highlights our achieve-
ments in 2005:
• Total sales increased 5.6 percent to
$5.7 billion
• Pre-tax profit increased 8.3 percent to
$405 million
• Earnings per share from continuing
operations increased to $1.67
• Cash position, net of debt, increased
by $134 million
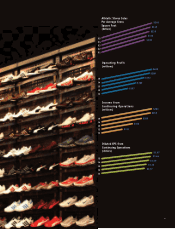
Looking beyond these highlights, 2005
was also a year in which we met a key tar-
geted performance metric. We are pleased
that we exceeded our $350 sales per aver-
age gross square foot objective -- a goal
that we established earlier this decade.
The improvement in this performance
metric provides evidence that the strate-
gies we are employing, designed to
enhance the sales productivity of our
store fleet, are working as intended.
Going forward, we have raised the bar and
currently believe that we can enhance the
productivity of our stores even further
and, over time, achieve sales of $400 per
average gross square foot within the next
several years.
We are also pleased with our continu-
ing success in enhancing the Company's
financial position and utilizing our oper-
ating cash flow of $355 million to deliver
increased value for shareholders. Key
investment decisions made during the
year included:
• Investing $163 million in capital
expenditures
• Contributing $26 million to our pen-
sion funds
• Repaying $35 million of long-term
debt
• Paying $49 million of dividends to our
shareholders
• Repurchasing $35 million of our com-
mon stock
At year end, the Company's cash and
short-term investment position, net of
long-term debt and capital leases, stood
at $261 million, reflecting our strong
financial position and balance sheet.
Overall, our business produced solid sales and pre-tax earnings increases in
2005 while also generating strong cash flow that we are actively redeploying
to benefit our shareholders.
2