Foot Locker 2005 Annual Report Download - page 26
Download and view the complete annual report
Please find page 26 of the 2005 Foot Locker annual report below. You can navigate through the pages in the report by either clicking on the pages listed below, or by using the keyword search tool below to find specific information within the annual report.-
 1
1 -
2
-
3
-
4
-
5
-
6
-
7
-
8
-
9
-
10
-
11
-
12
-
13
-
14
-
15
-
 16
16 -
 17
17 -
 18
18 -
 19
19 -
 20
20 -
 21
21 -
 22
22 -
 23
23 -
 24
24 -
 25
25 -
 26
26 -
 27
27 -
 28
28 -
 29
29 -
 30
30 -
 31
31 -
 32
32 -
 33
33 -
 34
34 -
 35
35 -
 36
36 -
37
-
38
-
39
-
40
-
41
-
42
-
43
-
44
-
45
-
46
-
47
-
48
-
49
-
50
-
51
-
52
-
53
-
54
-
55
-
56
-
57
-
58
-
59
-
60
-
61
-
62
-
63
-
64
-
65
-
66
-
67
-
68
-
69
-
70
-
71
-
72
-
73
-
74
-
75
-
76
-
77
-
78
-
79
-
80
-
81
-
82
-
83
-
84
-
85
-
86
-
87
-
88
-
89
-
90
-
91
-
92
-
93
-
94
-
95
-
96
-
97
-
98
-
99
-
100
-
101
-
102
-
103
-
104
-
105
-
106
-
107
-
108
-
109
-
110
-
111
-
112
-
113
-
114
-
115
-
116
-
117
-
118
-
119
-
120
-
121
-
122
-
123
-
124
-
125
-
126
-
127
-
128
-
129
-
130
-
131
-
132
-
133
 |
 |

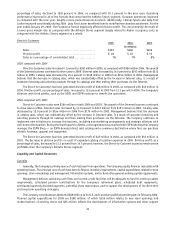
Interest Expense, Net
2005 2004 2003
(in millions)
Interest expense ............................................ $ 23 $ 22 $ 26
Interest income............................................. (13) (7) (8)
Interest expense, net .................................. $ 10 $ 15 $ 18
Weighted-average interest rate (excluding facility fees):
Short-term debt........................................ —% —% —%
Long-term debt ........................................ 6.2% 5.2% 6.1%
Total debt ............................................. 6.2% 5.2% 6.1%
Short-term debt outstanding during the year:
High ................................................... $ — $ — $ —
Weighted-average...................................... $ — $ — $ —
Interest expense of $23 million increased by 4.5 percent in 2005 from $22 million in 2004. Interest rate swap
agreements reduced interest expense by approximately $1 million and $3 million in 2005 and 2004, respectively. The
increase in 2005 was primarily attributable to higher interest rates.
Interest income is generated through the investment of cash equivalents, short-term investments, the accretion of
the Northern Group note to its face value and accrual of interest on the outstanding principal, as well as, interest on income
tax refunds. The increase in interest income of $6 million in 2005 was primarily related to increased interest income earned
on short-term investments due to higher interest rates and increased short-term investment balances. Interest income
on the Northern Group note amounted to $2 million in both 2005 and 2004. Interest income related to cash equivalents
and short-term investments was $11 million in 2005 and $5 million in 2004.
Interest expense of $22 million declined by 15.4 percent in 2004 from $26 million in 2003. The decrease in 2004
was primarily attributable to the Company’s $150 million 5.50 percent convertible subordinated notes that were converted
to equity in June 2004. Also contributing to the reduction in interest expense was the repurchase of $19 million of the
8.50 percent debentures payable in 2022 in the latter part of 2003. Interest rate swap agreements reduced interest expense
by approximately $3 million and $4 million in 2004 and 2003, respectively. These decreases were offset, in part, by an
increase resulting from the interest on the $175 million term loan that commenced in May 2004.
Interest income related to cash equivalents and short-term investments decreased by $1 million in 2004 from 2003
as a result of the reduction of interest income earned on tax refunds and settlements as they were received during 2003.
Interest income related to cash equivalents and short-term investments was $5 million in 2004 and 2003.
Income Taxes
The effective tax rate for 2005 was 35.0 percent as compared with 31.7 percent in the prior year. The increase was
attributable to less benefit from non-recurring items than in 2004 and a higher percentage of the Company’s income earned
in the United States, rather than from lower-taxed international operations. During 2005, the Company restructured its
Canadian continuing business, which resulted in a $6 million reduction to its income tax valuation allowance related to
Canadian tax loss carry-forwards and unclaimed tax depreciation. Additionally, the Company recorded an income tax
benefit of $3 million in discontinued operations related to its former Canadian operations.
The effective tax rate for 2004 was 31.7 percent, as compared with 35.5 percent in the prior year. The reduction was
principally related to a lower rate of tax on the Company’s foreign operations and the settlement of tax examinations.
During 2004, the Commonwealth of Puerto Rico concluded an examination of the Company’s branch income tax returns,
including an income tax audit for the years 1994 through 1999 and a branch profit tax audit for the years 1994 through
2002. As a result, the Company reduced its income tax provision for continuing operations by $2 million. Also during 2004,
the IRS completed its survey of the Company’s income tax returns for the years from 1999-2001 and its examination of
the 2002 year. The IRS and the Company completed a pre-filing review and post-filing review of the Company’s income
tax return for 2003. As a result of these actions by the IRS and the completion of the Company’s analysis, the Company
reduced its income tax provision for continuing operations by $12 million and discontinued operations by $37 million.
The effective rate for 2003 was 35.5 percent, as compared with 34.2 percent in 2002. The increased tax rate was
primarily due to the Company recording tax benefits of $5 million in 2003 as compared to $9 million in 2002. In addition
10