Chevron 2004 Annual Report Download - page 93
Download and view the complete annual report
Please find page 93 of the 2004 Chevron annual report below. You can navigate through the pages in the report by either clicking on the pages listed below, or by using the keyword search tool below to find specific information within the annual report.-
 1
1 -
2
-
3
-
4
-
5
-
6
-
7
-
8
-
9
-
10
-
11
-
12
-
13
-
14
-
15
-
16
-
17
-
18
-
19
-
20
-
21
-
22
-
23
-
24
-
25
-
26
-
27
-
28
-
29
-
30
-
31
-
32
-
33
-
34
-
35
-
36
-
37
-
38
-
39
-
40
-
41
-
42
-
43
-
44
-
45
-
46
-
47
-
48
-
49
-
50
-
51
-
52
-
53
-
54
-
55
-
56
-
57
-
58
-
59
-
60
-
61
-
62
-
63
-
64
-
65
-
66
-
67
-
68
-
69
-
70
-
71
-
72
-
73
-
74
-
75
-
76
-
77
-
78
-
79
-
80
-
81
-
82
-
 83
83 -
 84
84 -
 85
85 -
 86
86 -
 87
87 -
 88
88 -
 89
89 -
 90
90 -
 91
91 -
 92
92 -
 93
93 -
 94
94 -
 95
95 -
 96
96 -
 97
97 -
 98
98
 |
 |

CHEVRONTEXACO CORPORATION 2004 ANNUAL REPORT 91
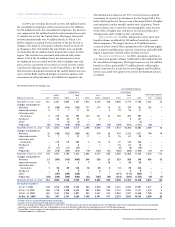
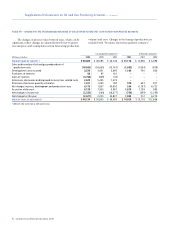
Consolidated Companies
United States International
Gulf of Total Asia- Total Affiliated Companies
Millionsofdollars Calif. Mexico Other U.S. Africa Pacific Indonesia Other Int’l. Total TCO Hamaca
Future cash inflows
from production
Future production costs
Future devel. costs
Future income taxes
Undiscounted future
net cash flows
10 percent midyear annual
discount for timing of
estimated cash flows
Future cash inflows
from production $ 30,307 $ 23,521 $ 33,251 $ 87,079 $ 55,532 $ 33,031 $ 26,288 $ 29,987 $ 144,838 $ 231,917 $ 56,485 $ 9,018
Future production costs (10,692) (5,003) (9,354) (25,049) (8,237) (6,389) (11,387) (6,334) (32,347) (57,396) (6,099) (1,878)
Future devel. costs (1,668) (1,550) (990) (4,208) (4,524) (2,432) (1,729) (1,971) (10,656) (14,864) (6,066) (463)
Future income taxes (6,073) (5,742) (7,752) (19,567) (25,369) (9,932) (5,993) (7,888) (49,182) (68,749) (12,520) (2,270)
Undiscounted future
net cash flows 11,874 11,226 15,155 38,255 17,402 14,278 7,179 13,794 52,653 90,908 31,800 4,407
10 percent midyear annual
discount for timing of
estimated cash flows (6,050) (3,666) (7,461) (17,177) (8,482) (6,392) (3,013) (5,039) (22,926) (40,103) (20,140) (2,949)
$ 5,824 $ 7,560 $ 7,694 $ 21,078 $ 8,920 $ 7,886 $ 4,166 $ 8,755 $ 29,727 $ 50,805 $ 11,660 $ 1,458
Future cash inflows
from production $ 27,111 $ 19,671 $ 31,130 $ 77,912 $ 52,513 $ 31,099 $ 28,451 $ 26,531 $ 138,594 $ 216,506 $ 52,457 $ 9,777
Future production costs (11,071) (5,167) (10,077) (26,315) (6,435) (4,534) (9,552) (5,970) (26,491) (52,806) (4,959) (1,730)
Future devel. costs (1,769) (748) (1,116) (3,633) (3,454) (2,516) (1,989) (1,868) (9,827) (13,460) (5,377) (578)
Future income taxes (4,829) (4,655) (6,747) (16,231) (25,060) (10,087) (7,694) (6,797) (49,638) (65,869) (11,899) (2,540)
Undiscounted future
net cash flows 9,442 9,101 13,190 31,733 17,564 13,962 9,216 11,896 52,638 84,371 30,222 4,929
10 percent midyear annual
discount for timing of
estimated cash flows (4,713) (2,493) (6,666) (13,872) (8,252) (6,297) (3,674) (3,691) (21,914) (35,786) (18,964) (3,581)
$ 4,729 $ 6,608 $ 6,524 $ 17,861 $ 9,312 $ 7,665 $ 5,542 $ 8,205 $ 30,724 $ 48,585 $ 11,258 $ 1,348
* 2002 includes certain reclassifications to conform to 2004 presentation.
Thestandardizedmeasureofdiscountedfuturenetcashflows,
relatedtotheprecedingprovedoilandgasreserves,iscalculated
inaccordancewiththerequirementsofFAS69.Estimatedfuture
cashinflowsfromproductionarecomputedbyapplyingyear-
endpricesforoilandgastoyear-endquantitiesofestimated
netprovedreserves.Futurepricechangesarelimitedtothose
providedbycontractualarrangementsinexistenceattheendof
eachreportingyear.Futuredevelopmentandproductioncosts
arethoseestimatedfutureexpendituresnecessarytodevelop
andproduceyear-endestimatedprovedreservesbasedonyear-
endcostindices,assumingcontinuationofyear-endeconomic
conditions,andincludeestimatedcostsforassetretirementobli-
gations.Estimatedfutureincometaxesarecalculatedbyapplying
appropriateyear-endstatutorytaxrates.Theseratesreflect
allowabledeductionsandtaxcreditsandareappliedtoestimated
futurepretaxnetcashflows,lessthetaxbasisofrelatedassets.
Discountedfuturenetcashflowsarecalculatedusing10percent
midperioddiscountfactors.Discountingrequiresayear-by-year
estimateofwhenfutureexpenditureswillbeincurredandwhen
reserveswillbeproduced.
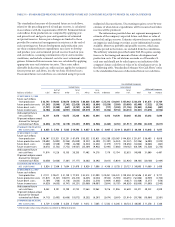
Theinformationprovideddoesnotrepresentmanagement’s
estimateofthecompany’sexpectedfuturecashflowsorvalueof
provedoilandgasreserves.Estimatesofprovedreservequantities
areimpreciseandchangeovertimeasnewinformationbecomes
available.Moreover,probableandpossiblereserves,whichmay
becomeprovedinthefuture,areexcludedfromthecalculations.
ThearbitraryvaluationprescribedunderFAS69requiresassump-
tionsastothetimingandamountoffuturedevelopmentand
productioncosts.ThecalculationsaremadeasofDecember31
eachyearandshouldnotberelieduponasanindicationofthe
company’sfuturecashflowsorvalueofitsoilandgasreserves.In
thefollowingtable,“StandardizedMeasureNetCashFlows”refers
tothestandardizedmeasureofdiscountedfuturenetcashflows.