Chevron 2004 Annual Report Download - page 63
Download and view the complete annual report
Please find page 63 of the 2004 Chevron annual report below. You can navigate through the pages in the report by either clicking on the pages listed below, or by using the keyword search tool below to find specific information within the annual report.-
 1
1 -
2
-
3
-
4
-
5
-
6
-
7
-
8
-
9
-
10
-
11
-
12
-
13
-
14
-
15
-
16
-
17
-
18
-
19
-
20
-
21
-
22
-
23
-
24
-
25
-
26
-
27
-
28
-
29
-
30
-
31
-
32
-
33
-
34
-
35
-
36
-
37
-
38
-
39
-
40
-
41
-
42
-
43
-
44
-
45
-
46
-
47
-
48
-
49
-
50
-
51
-
52
-
 53
53 -
 54
54 -
 55
55 -
 56
56 -
 57
57 -
 58
58 -
 59
59 -
 60
60 -
 61
61 -
 62
62 -
 63
63 -
 64
64 -
 65
65 -
 66
66 -
 67
67 -
 68
68 -
 69
69 -
 70
70 -
 71
71 -
 72
72 -
 73
73 -
74
-
75
-
76
-
77
-
78
-
79
-
80
-
81
-
82
-
83
-
84
-
85
-
86
-
87
-
88
-
89
-
90
-
91
-
92
-
93
-
94
-
95
-
96
-
97
-
98
 |
 |

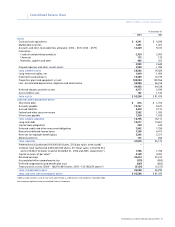
CHEVRONTEXACO CORPORATION 2004 ANNUAL REPORT 61
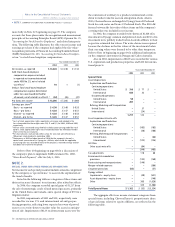
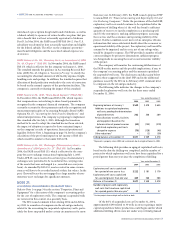
SegmentAssets Segmentassetsdonotincludeintercompany
investmentsorintercompanyreceivables.Segmentassetsat
year-end2004and2003follow:
At December 31
2003
United States $ 12,501
International 28,520
41,021
United States 9,354
International 17,627
26,981
United States 2,165
International 662
2,827
70,829
United States 6,644
International 3,997
10,641
30,664
50,806
$ 81,470
* All Other assets consist primarily of worldwide cash, cash equivalents and mar-
ketable securities, real estate, information systems, the company’s investment in
Dynegy, coal mining operations, power generation businesses, technology com-
panies, and assets of the corporate administrative functions.
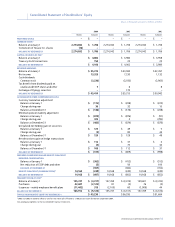
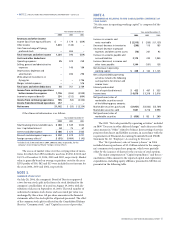
SegmentSalesandOtherOperatingRevenues Operatingsegment
salesandotheroperatingrevenues,includinginternaltransfers,
fortheyears2004,2003and2002arepresentedinthefollowing
table.Productsaretransferredbetweenoperatingsegmentsat
internalproductvaluesthatapproximatemarketprices.
Revenuesfortheupstreamsegmentarederivedprimarily
fromtheproductionofcrudeoilandnaturalgas,aswellasthe
saleofthird-partyproductionofnaturalgas.Revenuesforthe
downstreamsegmentarederivedfromtherefiningandmarketing
ofpetroleumproducts,suchasgasoline,jetfuel,gasoils,kero-
sene,lubricants,residualfueloilsandotherproductsderived
fromcrudeoil.Thissegmentalsogeneratesrevenuesfromthe
transportationandtradingofcrudeoilandrefinedproducts.
Revenuesforthechemicalssegmentarederivedprimarilyfromthe
manufactureandsaleofadditivesforlubricantsandfuel.“All
Other”activitiesincluderevenuesfromcoalminingoperations,
powergenerationbusinesses,insuranceoperations,realestate
activitiesandtechnologycompanies.
OtherthantheUnitedStates,theonlycountrywhereChevron-
TexacogeneratessignificantrevenuesistheUnitedKingdom,
whererevenuesamountedto$13,985,$12,121and$10,816in
2004,2003and2002,respectively.
Year ended December 31
2003 2002
United States $ 6,842 $ 4,923
Intersegment 6,295 4,217
Total United States 13,137 9,140
International 7,013 5,360
Intersegment 8,142 8,301
Total International 15,155 13,661
28,292 22,801
United States 44,701 33,881
Excise taxes 3,744 3,990
Intersegment 225 163
Total United States 48,670 38,034
International 52,486 45,759
Excise taxes 3,342 3,006
Intersegment 46 38
Total International 55,874 48,803
104,544 86,837
United States 323 323
Intersegment 129 109
Total United States 452 432
International 677 638
Excise taxes 9 10
Intersegment 83 68
Total International 769 716
1,221 1,148
United States 338 413
Intersegment 121 105
Total United States 459 518
International 100 37
Intersegment 4 –
Total International 104 37
563 555
United States 62,718 48,124
International 71,902 63,217
134,620 111,341
Elimination of intersegment sales (15,045) (13,001)
$ 119,575 $ 98,340
OPERATING SEGMENTS AND GEOGRAPHIC DATA – Continued