Chevron 2004 Annual Report Download - page 36
Download and view the complete annual report
Please find page 36 of the 2004 Chevron annual report below. You can navigate through the pages in the report by either clicking on the pages listed below, or by using the keyword search tool below to find specific information within the annual report.-
 1
1 -
2
-
3
-
4
-
5
-
6
-
7
-
8
-
9
-
10
-
11
-
12
-
13
-
14
-
15
-
16
-
17
-
18
-
19
-
20
-
21
-
22
-
23
-
24
-
25
-
 26
26 -
 27
27 -
 28
28 -
 29
29 -
 30
30 -
 31
31 -
 32
32 -
 33
33 -
 34
34 -
 35
35 -
 36
36 -
 37
37 -
 38
38 -
 39
39 -
 40
40 -
 41
41 -
 42
42 -
 43
43 -
 44
44 -
 45
45 -
 46
46 -
47
-
48
-
49
-
50
-
51
-
52
-
53
-
54
-
55
-
56
-
57
-
58
-
59
-
60
-
61
-
62
-
63
-
64
-
65
-
66
-
67
-
68
-
69
-
70
-
71
-
72
-
73
-
74
-
75
-
76
-
77
-
78
-
79
-
80
-
81
-
82
-
83
-
84
-
85
-
86
-
87
-
88
-
89
-
90
-
91
-
92
-
93
-
94
-
95
-
96
-
97
-
98
 |
 |

34 CHEVRONTEXACO CORPORATION 2004 ANNUAL REPORT
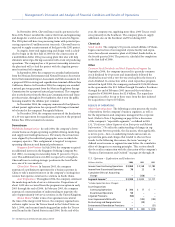
Management’s Discussion and Analysis of Financial Condition and Results of Operations
Explanationsfollowforvariationsbetweenyearsforthe
amountsinthetableabove–afterconsiderationoftheeffectsof
specialgainsandcharges–aswellasforotherincomestatement
categories.Refertotheprecedingsegmentdiscussionsinthissec-
tionforinformationrelatingtospecialgainsandcharges.
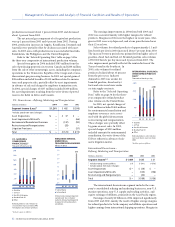
Salesandotheroperatingrevenueswere$151billionin2004,
comparedwith$120billionin2003and$98billionin2002.Rev-
enuesincreasedin2004and2003primarilyfromhigherprices
forcrudeoil,naturalgasandrefinedproductsworldwide.
Income(loss)fromequityaffiliatesincreasedin2004and
2003,asearningsimprovedforanumberofaffiliates,including
downstreamaffiliatesintheAsia-Pacificarea,Tengizchevroil,
CPChem,DynegyandtheCaspianPipelineConsortium.
Otherincomein2004includednetgainsof$1.6billion,
primarilyfromupstreampropertysales,comparedwithgains
of$286millionand$94millionin2003and2002,respectively.
Interestincomeincreasedto$199millionin2004,compared
withabout$120millionin2003and2002,asaresultofhigher
balancesofcashandmarketablesecurities.Foreigncurrency
losseswere$60million,$199millionand$5millionin2004,
2003and2002,respectively.
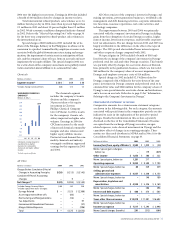
Purchasedcrudeoilandproductswere$94billionin2004,
anincreaseof32percentfrom2003,duemainlytohigherprices
andincreasedpurchasesofcrudeoilandproducts.Crudeoiland
productpurchasesincreasedabout25percentin2003,primarily
duetosignificantlyhigherpricesforcrudeoil,naturalgasand
refinedproducts.
Operating,selling,generalandadministrativeexpensesof
$14billionincreasedfrom$13billionin2003.Theincreasesin
2004includedcostsforcharteringofcrudeoiltankersandother
transportationexpenses.During2003,operating,selling,general
andadministrativeexpensesincreasednearly$1billion,primar-
ilyfromhigherfreightratesforinternationalshippingoperations
andhighercostsassociatedwithemployeepensionplansand
otheremployee-benefitexpenses.
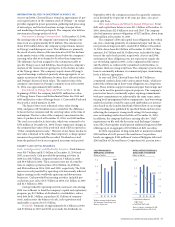
Explorationexpenseswere$697millionin2004,$570mil-
lionin2003and$591millionin2002.In2004,amountswere
higherforinternationaloperations,primarilyforseismiccosts
andexpensesassociatedwithevaluatingthefeasibilityofdifferent
projectalternatives.
Depreciation,depletionandamortizationexpensesdidnot
changemateriallybetweenyearsafterconsiderationoftheeffects
ofspecial-itemcharges.
Interestanddebtexpensewas$406millionin2004,com-
paredwith$474millionin2003and$565millionin2002.The
loweramountin2004reflectedloweraveragedebtbalances.The
declinebetween2003and2002reflectedloweraverageinterest
ratesoncommercialpaperandothervariable-ratedebtandlower
averagedebtlevels.
Taxesotherthanonincomewere$19.8billion,$17.9billion
and$16.7billionin2004,2003and2002,respectively.The
increasein2004and2003primarilyreflectedtheweakening
U.S.dollaronforeigncurrency-denominateddutiesinthe
company’sEuropeandownstreamoperations.
Incometaxexpensecorrespondedtoeffectivetaxratesof
37percentin2004,43percentin2003and45percentin2002after
takingintoaccounttheeffectofnetspecialitems.Referalsoto
Note17onpage66totheConsolidatedFinancialStatements.
Merger-relatedexpenseswere$576millionin2002.No
merger-relatedexpenseswerereportedin2004or2003,reflecting
thecompletionofmergerintegrationactivitiesin2002.
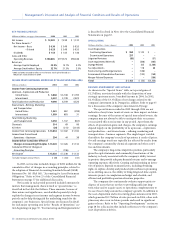
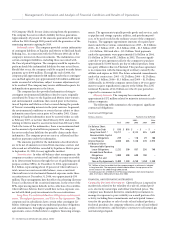
2003 2002
Net Crude Oil and Natural Gas
Liquids Production (MBPD) 562 602
Net Natural Gas Production (MMCFPD)3 2,228 2,405
Net Oil-Equivalent Production (MBOEPD) 933 1,003
Natural Gas Sales (MMCFPD) 4,304 5,891
Natural Gas Liquids Sales (MBPD) 194 241
Revenues From Net Production
Liquids ($/Bbl) $ 26.66 $ 21.34
Natural Gas ($/MCF) $ 5.01 $ 2.89
Net Crude and Natural Gas
Liquids Production (MBPD) 1,246 1,295
Net Natural Gas Production (MMCFPD)3 2,064 1,971
Net Oil-Equivalent Production (MBOEPD)4 1,704 1,720
Natural Gas Sales (MMCFPD) 1,951 3,131
Natural Gas Liquids Sales (MBPD) 107 131
Revenues From Liftings
Liquids ($/Bbl) $ 26.79 $ 23.06
Natural Gas ($/MCF) $ 2.64 $ 2.14
U.S. 933 1,003
International 1,704 1,720
Total 2,637 2,723
Gasoline Sales (MBPD) 669 680
Other Refined Products Sales (MBPD) 767 920
Total5 1,436 1,600
Refinery Input (MBPD)6 951 979
Gasoline Sales (MBPD) 643 620
Other Refined Products Sales (MBPD) 1,659 1,555
Total7 2,302 2,175
Refinery Input (MBPD) 1,040 1,100
1 Includes equity in affiliates.
2 MBPD = Thousands of barrels per day; MMCFPD = Millions of cubic feet per day;
MBOEPD = Thousands of barrels of oil equivalents per day; Bbl = Barrel; MCF =
Thousands of cubic feet. Oil-equivalent gas (OEG) conversion ratio is 6,000 cubic
feet of gas = 1 barrel of oil.
3 Includes natural gas consumed on lease:
United States 65 64
International 268 256
4 Other produced volumes include:
Athabasca Oil Sands – Net 15 –
Boscan Operating Service Agreement 99 97
114 97
5 Includes volume for buy/sell contracts: 90 101
6 The company sold its interest in the El Paso
Refinery in August 2003.
7 Includes volume for buy/sell contracts: 104 96