Chevron 2004 Annual Report Download - page 34
Download and view the complete annual report
Please find page 34 of the 2004 Chevron annual report below. You can navigate through the pages in the report by either clicking on the pages listed below, or by using the keyword search tool below to find specific information within the annual report.-
 1
1 -
2
-
3
-
4
-
5
-
6
-
7
-
8
-
9
-
10
-
11
-
12
-
13
-
14
-
15
-
16
-
17
-
18
-
19
-
20
-
21
-
22
-
23
-
 24
24 -
 25
25 -
 26
26 -
 27
27 -
 28
28 -
 29
29 -
 30
30 -
 31
31 -
 32
32 -
 33
33 -
 34
34 -
 35
35 -
 36
36 -
 37
37 -
 38
38 -
 39
39 -
 40
40 -
 41
41 -
 42
42 -
 43
43 -
 44
44 -
45
-
46
-
47
-
48
-
49
-
50
-
51
-
52
-
53
-
54
-
55
-
56
-
57
-
58
-
59
-
60
-
61
-
62
-
63
-
64
-
65
-
66
-
67
-
68
-
69
-
70
-
71
-
72
-
73
-
74
-
75
-
76
-
77
-
78
-
79
-
80
-
81
-
82
-
83
-
84
-
85
-
86
-
87
-
88
-
89
-
90
-
91
-
92
-
93
-
94
-
95
-
96
-
97
-
98
 |
 |
32 CHEVRONTEXACO CORPORATION 2004 ANNUAL REPORT
Management’s Discussion and Analysis of Financial Condition and Results of Operations
productionincreasedabout1percentfrom2003anddecreased
about1percentfrom2002.
Thenetnaturalgascomponentofoil-equivalentproduction
wasup1percentfrom2003and6percentfrom2002.During
2004,productionincreasesinAngola,Kazakhstan,Denmarkand
Australiawerepartiallyoffsetbydeclinesassociatedwithasset
sales.In2003,areaswithproductionincreasesincludedAustralia,
Kazakhstan,thePhilippinesandtheUnitedKingdom.
Refertothe“SelectedOperatingData”tableonpage34for
thethree-yearcomparativeofinternationalproductionvolumes.
Special-itemgainsin2004included$585millionfromthe
saleofproducingpropertiesinwesternCanadaand$266million
fromthesaleofothernonstrategicassets,includingthecompany’s
operationsintheDemocraticRepublicoftheCongoandaCana-
diannatural-gasprocessingbusiness.In2003,netspecialgainsof
$98millionincludedbenefitsof$150millionrelatedtoincome
taxesandpropertysales,partiallyoffsetbyassetimpairments
inadvanceofsaleandchargesforemployeeterminationcosts.
In2002,specialchargesof$137millionincluded$100million
forassetimpairmentsresultingfromthewrite-downofproved
reservesforfieldsinAfricaandCanada.
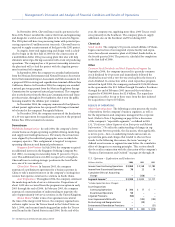
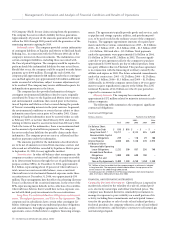
U.S.Downstream–Refining,MarketingandTransportation
Millionsofdollars 2003 2002
$ 482 $ (398)
*Includes Special-Item Gains (Charges):
Asset Dispositions $ 37 $ –
Asset Impairments/Write-offs – (66)
Environmental Remediation Provisions (132) (92)
Restructuring and Reorganizations (28) –
Litigation Provisions – (57)
Total $ (123) $ (215)
Theearningsimprovementin2004fromboth2003and
2002wasassociatedmainlywithhighermarginsforrefined
products.Marginsin2004werethehighestinrecentyears.Mar-
ginsin2002wereverydepressed,andatonepointhoverednear
their12-yearlows.
Salesvolumesforrefinedproductsofapproximately1.5mil-
lionbarrelsperdayin2004increasedabout5percentfrom2003.
Theincreasebetweenperiodswasprimarilyfromhighersalesof
gasoline,dieselfuelandfueloil.Brandedgasolinesalesvolumes
of567,000barrelsperdayincreased2percentfrom2003.The
salesimprovementpartiallyreflectedthereintroductionofthe
TexacobrandintheSoutheast.In
2003,salesvolumesforrefined
productsdeclinedabout10percent
fromtheprioryear.Industry
demandin2003wasweakerfor
brandedgasoline,dieselandjet
fuelsandsaleswerelowerunder
certainsupplycontracts.
Refertothe“SelectedOperating
Data”tableonpage34forthethree-
yearcomparativerefined-product
salesvolumesintheUnitedStates.
In2003,netspecialchargesof
$123millionincluded$160million
forenvironmentalremediationand
employeeseverancecostsassoci-
atedwiththeglobaldownstream
restructuringandreorganization.
Thesechargeswerepartiallyoffset
bygainsonassetsales.In2002,
specialchargesof$215million
includedamountsforenvironmental
remediation,thewrite-downofthe
ElPasorefineryinadvanceofsale
andalitigationmatter.
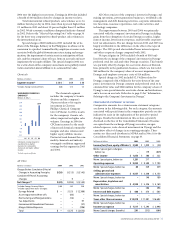
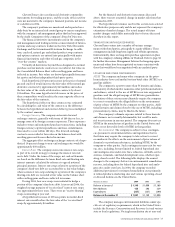
InternationalDownstream–
Refining,MarketingandTransportation
Millionsofdollars 2003 2002
$ 685 $ 31
1 Includes Foreign Currency Effects: $ (141) $ (176)
2 Includes Special-Item Gains (Charges):
Asset Dispositions $ (24) $ –
Asset Impairments/Write-offs (123) (136)
Restructuring and Reorganizations (42) –
Total $ (189) $ (136)
Theinternationaldownstreamsegmentincludesthecom-
pany’sconsolidatedrefiningandmarketingbusinesses,non-U.S.
marineoperations,non-U.S.supplyandtradingactivities,and
equityearningsofaffiliates,primarilyintheAsia-Pacificregion.
Earningsofnearly$2billionin2004improvedsignificantly
from2003and2002,mainlytheresultofhigheraveragemargins
forrefinedproductsforbothcompanyandaffiliateoperationsand
higherearningsfrominternationalshippingoperations.Marginsin
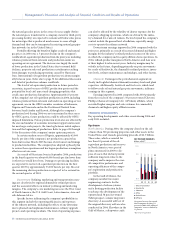
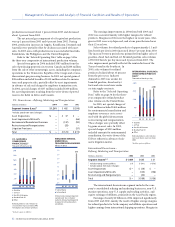
0
2100
1800
1500
1200
900
600
300
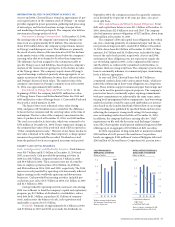
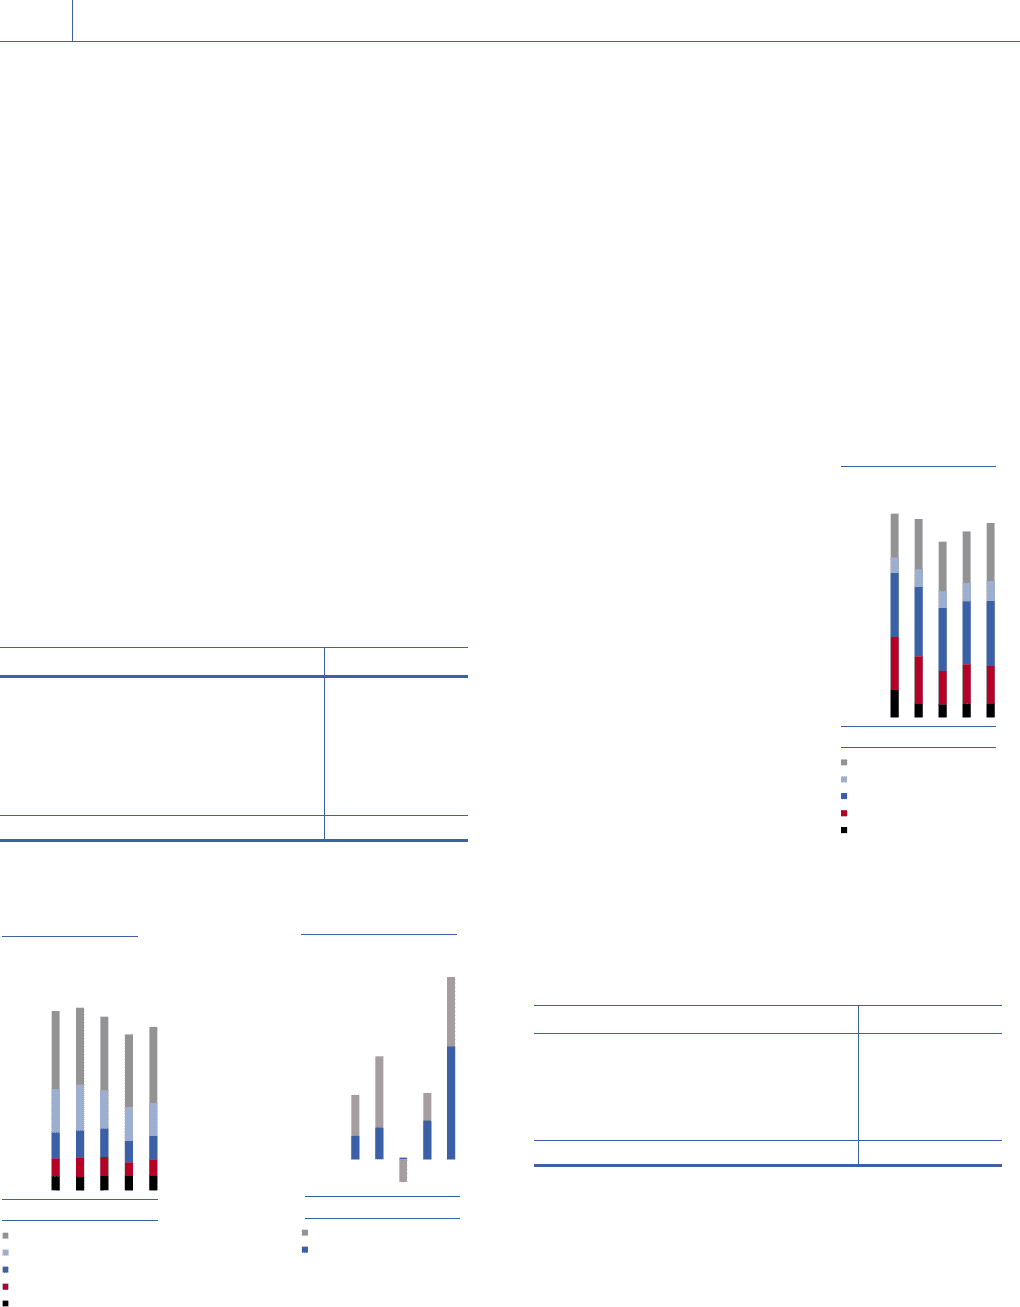
Thousands of barrels per day
Gasoline
Jet Fuel
Gas Oils & Kerosene
Residual Fuel Oil
Other
Refinedproductssalesvolumesin-
creasedabout5percentfrom2003,
withhighersalesofmostproducts.
�Includesequityinaffiliates
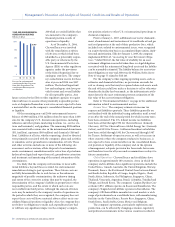
0100 02 03
-0.5
3.5
3.0
2.5
0.0
0.5
2.0
1.0
1.5
0100 02 03
Billions of dollars
United States
International
Downstreamearningsimproved
significantlyduetohigher
industrydemandandimproved
marginsforrefinedproducts
worldwide.
0
2800
2100
1400
700
0100 02 03
Thousands of barrels per day
Refinedproductssalesvolumes
increasedabout4percentfrom
2003.
�Includesequityinaffiliates
Gasoline
Jet Fuel
Gas Oils & Kerosene
Residual Fuel Oil
Other