Chevron 2004 Annual Report Download - page 30
Download and view the complete annual report
Please find page 30 of the 2004 Chevron annual report below. You can navigate through the pages in the report by either clicking on the pages listed below, or by using the keyword search tool below to find specific information within the annual report.-
 1
1 -
2
-
3
-
4
-
5
-
6
-
7
-
8
-
9
-
10
-
11
-
12
-
13
-
14
-
15
-
16
-
17
-
18
-
19
-
 20
20 -
 21
21 -
 22
22 -
 23
23 -
 24
24 -
 25
25 -
 26
26 -
 27
27 -
 28
28 -
 29
29 -
 30
30 -
 31
31 -
 32
32 -
 33
33 -
 34
34 -
 35
35 -
 36
36 -
 37
37 -
 38
38 -
 39
39 -
 40
40 -
41
-
42
-
43
-
44
-
45
-
46
-
47
-
48
-
49
-
50
-
51
-
52
-
53
-
54
-
55
-
56
-
57
-
58
-
59
-
60
-
61
-
62
-
63
-
64
-
65
-
66
-
67
-
68
-
69
-
70
-
71
-
72
-
73
-
74
-
75
-
76
-
77
-
78
-
79
-
80
-
81
-
82
-
83
-
84
-
85
-
86
-
87
-
88
-
89
-
90
-
91
-
92
-
93
-
94
-
95
-
96
-
97
-
98
 |
 |
28 CHEVRONTEXACO CORPORATION 2004 ANNUAL REPORT
Management’s Discussion and Analysis of Financial Condition and Results of Operations
thenaturalgassalespricesintheareasofexcesssupply(before
thenaturalgasistransferredtoacompany-ownedorthird-party
processingfacility)areexpectedtoremainwellbelowsalesprices
fornaturalgasthatisproducedmuchnearertoareasofhigh
demandandthatcanbetransportedinexistingnaturalgaspipe-
linenetworks(asintheUnitedStates).
Partiallyoffsettingthebenefitofhighercrudeoilandnatural
gaspricesin2004wasa5percentdeclineinthecompany’s
worldwideoil-equivalentproductionfromtheprioryear,including
volumesproducedfromoilsandsandproductionunderan
operatingserviceagreement.Thedecreasewaslargelytheresult
oflowerproductionintheUnitedStatesduetonormalfield
declines,propertysalesandproductioncurtailmentsresulting
fromdamagestoproducingoperationscausedbyHurricane
Ivan.Internationaloil-equivalentproductionwasdownmargin-
allybetweenyears.Referalsotopage32foradditionaldiscussion
anddetailofproductionvolumesworldwide.
Thelevelofoil-equivalentproductioninfutureperiodsis
uncertain,inpartbecauseofOPECproductionquotasandthe
potentialforlocalcivilunrestandchanginggeopoliticsthat
couldcauseproductiondisruptions.Approximately25percent
ofthecompany’snetoil-equivalentproductionin2004,including
volumesproducedfromoilsandsandunderanoperatingservice
agreement,wasintheOPEC-membercountriesofIndonesia,
NigeriaandVenezuelaandinthePartitionedNeutralZone
betweenSaudiArabiaandKuwait.Althoughthecompany’s
productionlevelduring2004wasnotconstrainedintheseareas
byOPECquotas,futureproductioncouldbeaffectedbyOPEC-
imposedlimitations.Futureproductionlevelsalsoareaffectedby
thesizeandnumberofeconomicinvestmentopportunitiesand,
fornewlarge-scaleprojects,thetimelagbetweeninitialexplora-
tionandthebeginningofproduction.Refertopages28through
30fordiscussionofthecompany’smajorupstreamprojects.
IncertainonshoreareasofNigeria,approximately45,000
barrelsperdayofthecompany’snetproductioncapacityhas
beenshutinsinceMarch2003becauseofcivilunrestanddamage
toproductionfacilities.Thecompanyhasadoptedaphasedplan
torestoretheseoperationsandhasbegunproduction-resumption
effortsincertainareas.
AsaresultofHurricaneIvaninSeptember2004,production
inthefourthquarterwasabout60,000barrelsperdaylowerthan
itotherwisewouldhavebeen.Damagestoproducingfacilities
areexpectedtorestrictoil-equivalentproductioninthefirst
quarter2005byapproximately35,000barrelsperday.Mostof
theremainingshut-inproductionisexpectedtoberestoredin
thesecondquarterof2005.
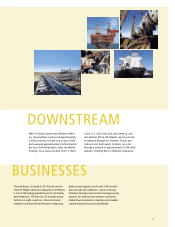
Downstream Refining,marketingandtransportationearn-
ingsarecloselytiedtoregionaldemandforrefinedproducts
andtheassociatedeffectsonindustryrefiningandmarketing
margins.Thecompany’scoremarketingareasaretheWestCoast
ofNorthAmerica,theU.S.GulfCoast,LatinAmerica,Asiaand
sub-SaharanAfrica.
Specificfactorsinfluencingthecompany’sprofitabilityin
thissegmentincludetheoperatingefficienciesandexpenses
oftherefinerynetwork,includingtheeffectsofanydowntime
duetoplannedandunplannedmaintenance,refineryupgrade
projectsandoperatingincidents.Thelevelofoperatingexpenses
canalsobeaffectedbythevolatilityofcharterexpensesforthe
company’sshippingoperations,whicharedrivenbytheindus-
try’sdemandforcrude-oiltankers.Factorsbeyondthecompany’s
controlincludethegenerallevelofinflation,especiallyenergy
coststooperatetherefinerynetwork.
Downstreamearningsimprovedin2004comparedwiththe
prioryear,primarilyasaresultofincreaseddemandandhigher
marginsfortheindustry’srefinedproductsinmostoftheareas
inwhichthecompanyanditsequityaffiliateshaveoperations.In
2004,refined-productmarginsinNorthAmericaandAsiawere
attheirhighestlevelinrecentyears.Industrymarginsmaybe
volatileinthefuture,dependingprimarilyonpricemovements
forcrudeoilfeedstocks,thedemandforrefinedproducts,inven-
torylevels,refinerymaintenanceandmishaps,andotherfactors.
Chemicals Earningsinthepetrochemicalssegmentare
closelytiedtoglobalchemicaldemand,inventorylevelsandplant
capacities.Additionally,feedstockandfuelcosts,whichtend
tofollowcrudeoilandnaturalgaspricemovements,influence
earningsinthissegment.
Earningsimprovedin2004comparedwith2003primarily
fromtheresultsofthecompany’s50percent-ownedChevron
PhillipsChemicalCompanyLLC(CPChem)affiliate,which
recordedhighermarginsandsalesvolumesforcommodity
chemicalsandhigherequityaffiliateincome.
Keyoperatingdevelopmentsandothereventsduring2004and
early2005included:
NorthAmerica During2004,thecompanyclosedonthesale
ofmorethan300producingpropertiesandotherassetsinthe
UnitedStatesandCanada,generatingproceedsof$2.5billion.
Thesesales,whichaccountedfor
lessthan10percentoftheoil-
equivalentproductionandreserves
inNorthAmerica,werepartof
plansannouncedin2003todis-
poseofassetsthatdidnotprovide
sufficientlong-termvaluetothe
companyandtoimprovetheover-
allcompetitiveperformanceand
operatingefficiencyofthecompa-
ny’sexplorationandproduction
portfolio.
IntheGulfofMexico,the
companyawardedtwomajor
engineeringcontractsforthe
developmentofsubseasystems
andafloatingproductionfacility
toadvancethedevelopmentofthe
operatedand58percent-owned
Tahitiprospect,amajordeepwater
discovery.Asuccessfulwelltestof
theoriginaldiscoverywellwasalso
conductedin2004.Elsewhereinthe
GulfofMexico,adeepwatercrude
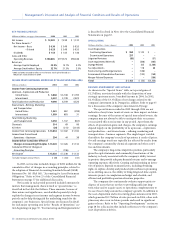
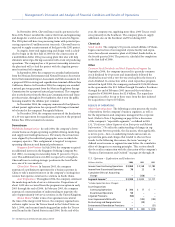
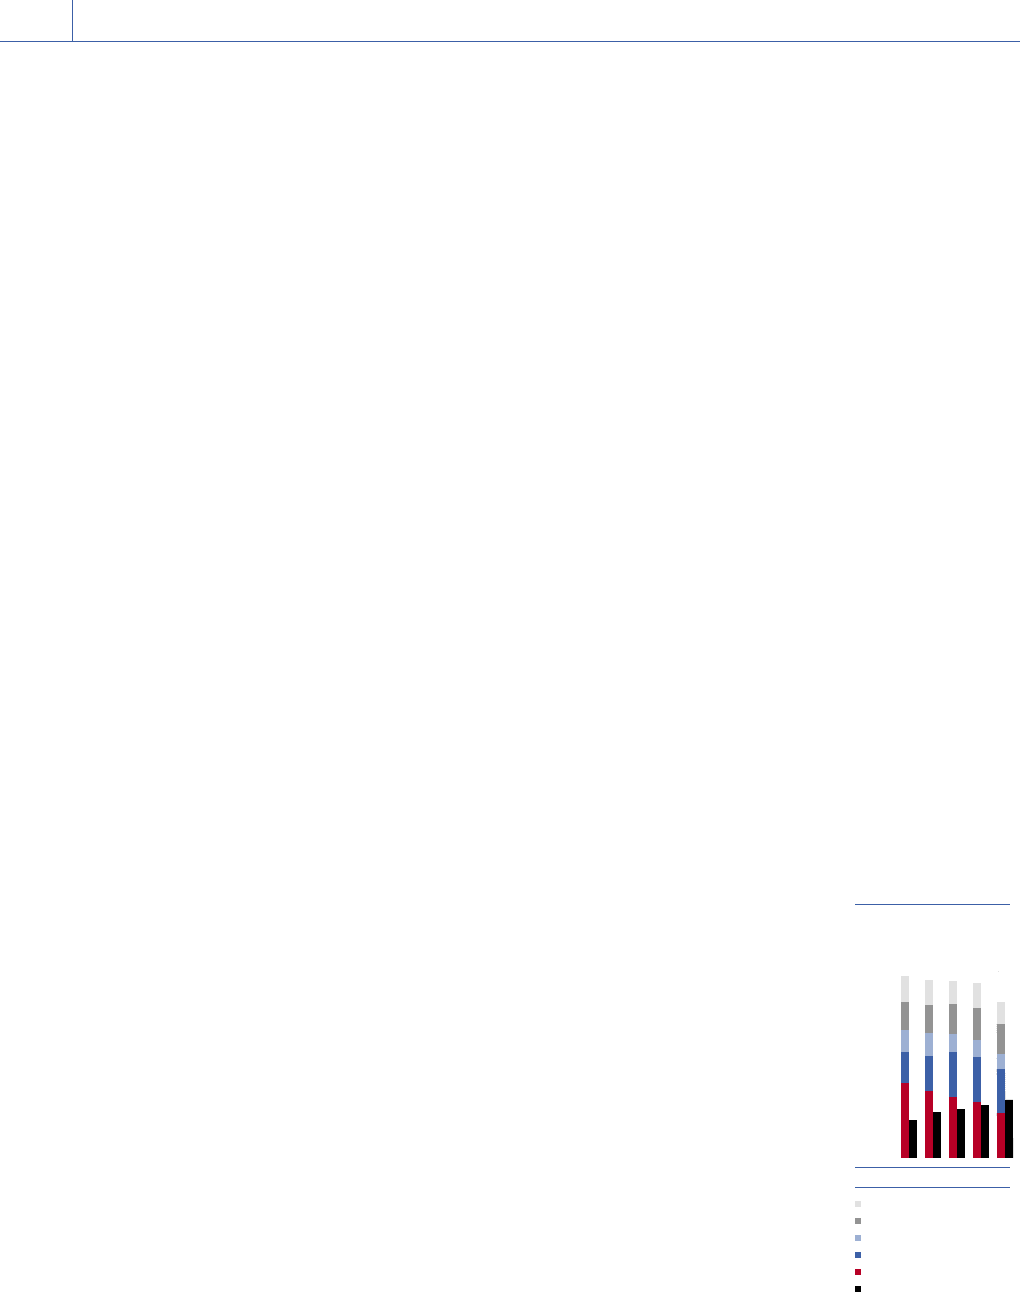
0.0
12.0
6.0
9.0
3.0
0100 02 03 04
8.2
3.1
Net proved reserves for consoli-
dated companies declined 11
percent in 2004, while affiliated
companies’ reserves climbed by
11 percent.
*Barrels of oil-equivalent
NET PROVED RESERVES
Billions of BOE*
Other International
Asia-Pacific
Indonesia
Africa
United States
Affiliates
#14A – Net Proved Reserves (front) – v7