Chevron 2004 Annual Report Download - page 28
Download and view the complete annual report
Please find page 28 of the 2004 Chevron annual report below. You can navigate through the pages in the report by either clicking on the pages listed below, or by using the keyword search tool below to find specific information within the annual report.-
 1
1 -
2
-
3
-
4
-
5
-
6
-
7
-
8
-
9
-
10
-
11
-
12
-
13
-
14
-
15
-
16
-
17
-
 18
18 -
 19
19 -
 20
20 -
 21
21 -
 22
22 -
 23
23 -
 24
24 -
 25
25 -
 26
26 -
 27
27 -
 28
28 -
 29
29 -
 30
30 -
 31
31 -
 32
32 -
 33
33 -
 34
34 -
 35
35 -
 36
36 -
 37
37 -
 38
38 -
39
-
40
-
41
-
42
-
43
-
44
-
45
-
46
-
47
-
48
-
49
-
50
-
51
-
52
-
53
-
54
-
55
-
56
-
57
-
58
-
59
-
60
-
61
-
62
-
63
-
64
-
65
-
66
-
67
-
68
-
69
-
70
-
71
-
72
-
73
-
74
-
75
-
76
-
77
-
78
-
79
-
80
-
81
-
82
-
83
-
84
-
85
-
86
-
87
-
88
-
89
-
90
-
91
-
92
-
93
-
94
-
95
-
96
-
97
-
98
 |
 |

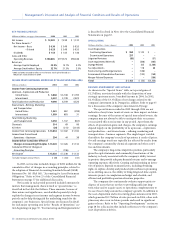
26 CHEVRONTEXACO CORPORATION 2004 ANNUAL REPORT
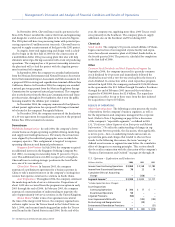
Millionsofdollars,exceptper-shareamounts 2003 2002
Net Income $ 7,230 $ 1,132
Per Share Amounts:*
Net Income – Basic $ 3.48 $ 0.53
– Diluted $ 3.48 $ 0.53
Dividends $ 1.43 $ 1.40
Sales and Other
Operating Revenues $ 119,575 $ 98,340
Return on:
Average Capital Employed 15.7% 3.2%
Average Stockholders’ Equity 21.3% 3.5%
* 2003 and 2002 restated to reflect a two-for-one stock split effected as a
100 percent stock dividend in 2004.
Millionsofdollars 2003 2002
Upstream – Exploration and Production
United States $ 3,160 $ 1,703
International 3,199 2,823
Total Exploration and Production 6,359 4,526
Downstream – Refining, Marketing
and Transportation
United States 482 (398)
International 685 31
Total Refining, Marketing
and Transportation 1,167 (367)
Chemicals 69 86
All Other (213) (3,143)
Income From Continuing Operations $ 7,382 $ 1,102
Income From Discontinued
Operations – Upstream 44 30
$ 7,426 $ 1,132
Cumulative Effect of Changes in
Accounting Principles (196) –
Net Income* $ 7,230 $ 1,132
*Includes Foreign Currency Effects: $ (404) $ (43)
In2003,netincomeincludedchargesof$200millionforthe
cumulativeeffectofchangesinaccountingprinciples,relatedto
theadoptionofFinancialAccountingStandardsBoard(FASB)
StatementNo.143(FAS143),“AccountingforAssetRetirement
Obligations.”RefertoNote25oftheConsolidatedFinancial
Statementsonpage77foradditionaldiscussion.
Netincomeineachperiodpresentedincludedamountsfor
mattersthatmanagementcharacterizedas“specialitems,”as
describedinthetablethatfollows.Theseamounts,becauseof
theirnatureandsignificance,areidentifiedseparatelytohelp
explainthechangesinnetincomeandsegmentincomebetween
periodsandtohelpdistinguishtheunderlyingtrendsforthe
company’scorebusinesses.Specialitemsarediscussedindetail
foreachmajoroperatingareainthe“ResultsofOperations”sec-
tionbeginningonpage30.“RestructuringandReorganizations”
isdescribedindetailinNote12totheConsolidatedFinancial
Statementsonpage63.
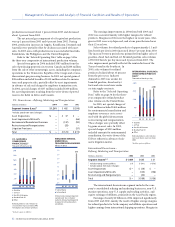
Millionsofdollars–Gains(charges) 2003 2002
Asset Dispositions
Continuing Operations $ 122 $ –
Discontinued Operations – –
Litigation Provisions – (57)
Asset Impairments/Write-offs (340) (485)
Dynegy-Related 325 (2,306)
Tax Adjustments 118 60
Restructuring and Reorganizations (146) –
Environmental Remediation Provisions (132) (160)
Merger-Related Expenses – (386)
$ (53) $ (3,334)
Asshowninthe“SpecialItems”table,netspecialgainsof
$1.2billion,associatedmainlywiththedispositionofnon-
strategicupstreamassets,benefitedincomein2004.In2002,
$2.3billionofthe$3.3billionofnetchargesrelatedtothe
company’sinvestmentinitsDynegyInc.affiliate.Refertopage35
foradiscussionofthecompany’sinvestmentinDynegy.
Thespecialitemsrecordedin2002through2004arenot
indicativeofanyfuturetrendsofeventsortheirimpactonfuture
earnings.Becauseofthenatureofspecialitem-relatedevents,the
companymaynotalwaysbeabletoanticipatetheiroccurrence
orassociatedeffectsonincomeinanyperiod.Apartfromthe
effectsofspecial-itemgainsandcharges,thecompany’searnings
dependlargelyontheprofitabilityofitsupstream–exploration
andproduction–anddownstream–refining,marketingand
transportation–businesssegments.Thesinglelargestvariable
thataffectsthecompany’sresultsofoperationsiscrudeoilprices.
Overallearningstrendsaretypicallylessaffectedbyresultsfrom
thecompany’scommoditychemicalssegmentandotheractivi-
tiesandinvestments.
Thecompany’slong-termcompetitiveposition,particularly
giventhecapital-intensiveandcommodity-basednatureofthe
industry,iscloselyassociatedwiththecompany’sabilitytoinvest
inprojectsthatprovideadequatefinancialreturnsandtomanage
operatingexpenseseffectively.Creatingandmaintaininganinven-
toryofprojectsdependsonmanyfactors,includingobtaining
rightstoexplore,developandproducehydrocarbonsinpromising
areas,drillingsuccess,theabilitytobringlong-lead-timecapital-
intensiveprojectstocompletiononbudgetandschedule,and
efficientandprofitableoperationofmatureproperties.
Thecompanyalsocontinuouslyevaluatesopportunitiesto
disposeofassetsthatarenotkeytoprovidingsufficientlong-
termvalueandtoacquireassetsoroperationscomplementaryto
itsassetbasetohelpsustainthecompany’sgrowth.Inadditionto
theasset-dispositionandrestructuringplansannouncedin2003,
whichgenerated$3.7billionofsalesproceedsin2004,othersuch
plansmayalsooccurinfutureperiodsandresultinsignificant
gainsorlosses.Refertothe“OperatingDevelopments”sectionon
page28foradiscussionthatincludesreferencestothecompany’s
assetdispositionactivities.
Management’s Discussion and Analysis of Financial Condition and Results of Operations