Chevron 2004 Annual Report Download - page 85
Download and view the complete annual report
Please find page 85 of the 2004 Chevron annual report below. You can navigate through the pages in the report by either clicking on the pages listed below, or by using the keyword search tool below to find specific information within the annual report.-
 1
1 -
2
-
3
-
4
-
5
-
6
-
7
-
8
-
9
-
10
-
11
-
12
-
13
-
14
-
15
-
16
-
17
-
18
-
19
-
20
-
21
-
22
-
23
-
24
-
25
-
26
-
27
-
28
-
29
-
30
-
31
-
32
-
33
-
34
-
35
-
36
-
37
-
38
-
39
-
40
-
41
-
42
-
43
-
44
-
45
-
46
-
47
-
48
-
49
-
50
-
51
-
52
-
53
-
54
-
55
-
56
-
57
-
58
-
59
-
60
-
61
-
62
-
63
-
64
-
65
-
66
-
67
-
68
-
69
-
70
-
71
-
72
-
73
-
74
-
 75
75 -
 76
76 -
 77
77 -
 78
78 -
 79
79 -
 80
80 -
 81
81 -
 82
82 -
 83
83 -
 84
84 -
 85
85 -
 86
86 -
 87
87 -
 88
88 -
 89
89 -
 90
90 -
 91
91 -
 92
92 -
 93
93 -
 94
94 -
 95
95 -
96
-
97
-
98
 |
 |

CHEVRONTEXACO CORPORATION 2004 ANNUAL REPORT 83
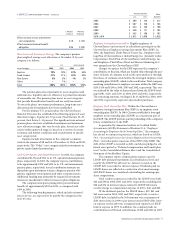
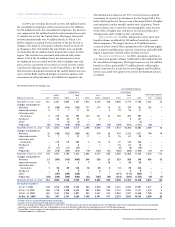
Consolidated Companies
United States International
Gulf of Total Asia- Total Affiliated Companies
Millionsofdollars Calif. Mexico Other U.S. Africa Pacific Indonesia Other Int’l. Total TCO Hamaca
Unproved properties
Proved properties and
related producing
assets
Support equipment
Deferred exploratory
wells
Other uncompleted
projects
ARO asset2
Unproved properties
valuation
Proved producing
properties –
depreciation and
depletion
Support equipment
depreciation
ARO asset depreciation2
Accumulated provisions
Unproved properties $ 769 $ 416 $ 131 $ 1,316 $ 290 $ 214 $ – $ 1,048 $ 1,552 $ 2,868 $ 108 $ –
Proved properties and
related producing
assets 8,785 18,069 10,749 37,603 6,474 6,288 3,097 10,469 26,328 63,931 2,091 356
Support equipment 200 200 277 677 519 100 3,016 374 4,009 4,686 425 –
Deferred exploratory
wells – 126 1 127 233 67 2 120 422 549 – –
Other uncompleted
projects 76 280 152 508 1,894 1,502 715 334 4,445 4,953 1,011 661
ARO asset2 25 227 83 335 207 60 23 236 526 861 20 1
9,855 19,318 11,393 40,566 9,617 8,231 6,853 12,581 37,282 77,848 3,655 1,018
Unproved properties
valuation 731 138 43 912 101 59 1 310 471 1,383 12 –
Proved producing
properties –
depreciation and
depletion 6,473 14,450 6,894 27,817 3,656 2,793 2,022 6,015 14,486 42,303 354 24
Support equipment
depreciation 141 133 180 454 237 68 1,784 200 2,289 2,743 160 –
ARO asset depreciation2 23 186 79 288 133 36 19 148 336 624 4 –
Accumulated provisions 7,368 14,907 7,196 29,471 4,127 2,956 3,826 6,673 17,582 47,053 530 24
$ 2,487 $ 4,411 $ 4,197 $ 11,095 $ 5,490 $ 5,275 $ 3,027 $ 5,908 $ 19,700 $ 30,795 $ 3,125 $ 994
1 Includes assets held for sale.
2 See Note 25, FAS 143, “Asset Retirement Obligations,” on page 77.
3 2003 and 2002 reclassified to conform to 2004 presentation.