Chevron 2004 Annual Report Download - page 7
Download and view the complete annual report
Please find page 7 of the 2004 Chevron annual report below. You can navigate through the pages in the report by either clicking on the pages listed below, or by using the keyword search tool below to find specific information within the annual report.-
 1
1 -
 2
2 -
 3
3 -
 4
4 -
 5
5 -
 6
6 -
 7
7 -
 8
8 -
 9
9 -
 10
10 -
 11
11 -
 12
12 -
 13
13 -
 14
14 -
 15
15 -
 16
16 -
 17
17 -
 18
18 -
19
-
20
-
21
-
22
-
23
-
24
-
25
-
26
-
27
-
28
-
29
-
30
-
31
-
32
-
33
-
34
-
35
-
36
-
37
-
38
-
39
-
40
-
41
-
42
-
43
-
44
-
45
-
46
-
47
-
48
-
49
-
50
-
51
-
52
-
53
-
54
-
55
-
56
-
57
-
58
-
59
-
60
-
61
-
62
-
63
-
64
-
65
-
66
-
67
-
68
-
69
-
70
-
71
-
72
-
73
-
74
-
75
-
76
-
77
-
78
-
79
-
80
-
81
-
82
-
83
-
84
-
85
-
86
-
87
-
88
-
89
-
90
-
91
-
92
-
93
-
94
-
95
-
96
-
97
-
98
 |
 |
5
55
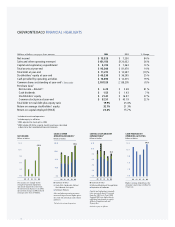
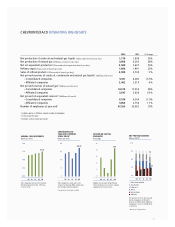
CHEVRONTEXACO OPERATING HIGHLIGHTS1
2003 % Change
Net production of crude oil and natural gas liquids (Thousandsofbarrelsperday) 1,808 (5)%
Net production of natural gas (Millionsofcubicfeetperday) 4,292 (8)%
Net oil-equivalent production (Thousandsofoil-equivalentbarrelsperday) 2,637 (5)%
Refi nery input (Thousandsofbarrelsperday) 1,991 (2)%
Sales of refi ned products (Thousandsofbarrelsperday) 3,738 5 %
Net proved reserves of crude oil, condensate and natural gas liquids2(Millionsofbarrels)
– Consolidated companies 6,280 (12)%
– Affi liated companies 2,319 6 %
Net proved reserves of natural gas2(Billionsofcubicfeet)
– Consolidated companies 17,553 (8)%
– Affi liated companies 2,638 34 %
Net proved oil-equivalent reserves2(Millionsofbarrels)
– Consolidated companies 9,206 (11)%
– Affi liated companies 2,758 11 %
Number of employees at year-end3 50,582 (7)%
1 Includes equity in affi liates, except number of employees
2 At the end of the year
3 Excludes service station personnel
0.00
2.00
1.50
1.00
0.50
0100 02 03
Dollars per share
Thecompanyincreaseditsannual
dividendpayoutforthe17thcon-
secutiveyear.
0
60
45
30
15
0100 02 03
Dollars per share
Thecompany’sstockpricerose
22percentduring2004,outpacing
thebroadermarketindexes.
�Adjustedforstocksplitin2004
0
30
24
18
12
6
0100 02 03
Percentage
Highernetincomehelpedboost
ChevronTexaco’sreturnoncapital
employedto25.8percent.
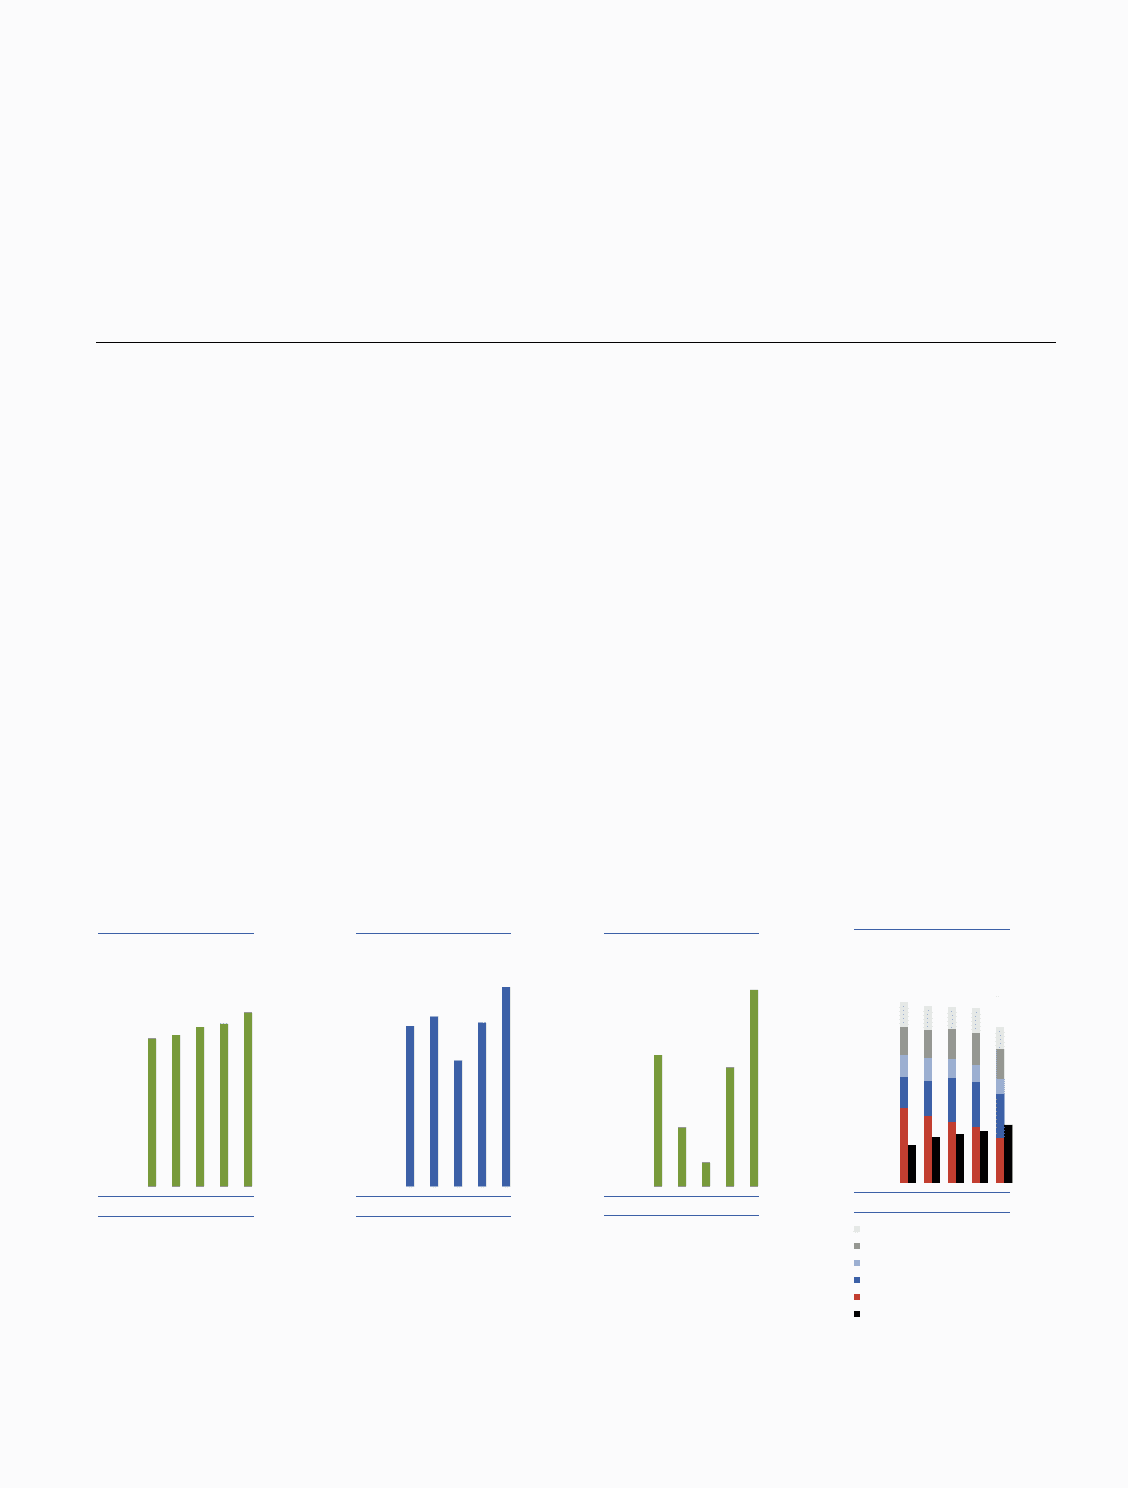
0.0
12.0
6.0
9.0
3.0
0100 02 03 04
8.2
3.1
Net proved reserves for consoli-
dated companies declined 11
percent in 2004, while affiliated
companies’ reserves climbed by
11 percent.
*Barrels of oil-equivalent
NET PROVED RESERVES
Billions of BOE*
Other International
Asia-Pacific
Indonesia
Africa
United States
Affiliates
#14A – Net Proved Reserves (front) – v7