Chevron 2004 Annual Report Download - page 86
Download and view the complete annual report
Please find page 86 of the 2004 Chevron annual report below. You can navigate through the pages in the report by either clicking on the pages listed below, or by using the keyword search tool below to find specific information within the annual report.-
 1
1 -
2
-
3
-
4
-
5
-
6
-
7
-
8
-
9
-
10
-
11
-
12
-
13
-
14
-
15
-
16
-
17
-
18
-
19
-
20
-
21
-
22
-
23
-
24
-
25
-
26
-
27
-
28
-
29
-
30
-
31
-
32
-
33
-
34
-
35
-
36
-
37
-
38
-
39
-
40
-
41
-
42
-
43
-
44
-
45
-
46
-
47
-
48
-
49
-
50
-
51
-
52
-
53
-
54
-
55
-
56
-
57
-
58
-
59
-
60
-
61
-
62
-
63
-
64
-
65
-
66
-
67
-
68
-
69
-
70
-
71
-
72
-
73
-
74
-
75
-
 76
76 -
 77
77 -
 78
78 -
 79
79 -
 80
80 -
 81
81 -
 82
82 -
 83
83 -
 84
84 -
 85
85 -
 86
86 -
 87
87 -
 88
88 -
 89
89 -
 90
90 -
 91
91 -
 92
92 -
 93
93 -
 94
94 -
 95
95 -
 96
96 -
97
-
98
 |
 |

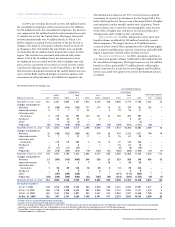
84 CHEVRONTEXACO CORPORATION 2004 ANNUAL REPORT
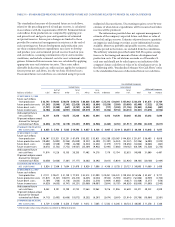
Consolidated Companies
United States International
Gulf of Total Asia- Total Affiliated Companies
Millionsofdollars Calif. Mexico Other U.S. Africa Pacific Indonesia Other Int’l. Total TCO Hamaca
Unproved properties $ 770 $ 421 $ 171 $ 1,362 $ 330 $ 237 $ 22 $ 1,134 $ 1,723 $ 3,085 $ 108 $ –
Proved properties and
related producing
assets 8,584 17,657 11,200 37,441 6,037 6,356 3,432 10,185 26,010 63,451 1,975 147
Support equipment 187 189 398 774 447 190 3,004 377 4,018 4,792 338 –
Deferred exploratory
wells – 101 1 102 167 103 – 106 376 478 – –
Other uncompleted
projects 97 209 200 506 1,380 1,179 474 264 3,297 3,803 676 693
9,638 18,577 11,970 40,185 8,361 8,065 6,932 12,066 35,424 75,609 3,097 840
Unproved properties
valuation 732 154 75 961 80 67 23 277 447 1,408 9 –
Proved producing
properties –
depreciation and
depletion 6,295 13,722 7,098 27,115 3,275 2,608 2,143 5,358 13,384 40,499 285 9
Future abandonment
and restoration 150 363 486 999 508 147 157 392 1,204 2,203 24 –
Support equipment
depreciation 130 123 304 557 289 100 1,764 223 2,376 2,933 138 –
Accumulated provisions 7,307 14,362 7,963 29,632 4,152 2,922 4,087 6,250 17,411 47,043 456 9
$ 2,331 $ 4,215 $ 4,007 $ 10,553 $ 4,209 $ 5,143 $ 2,845 $ 5,816 $ 18,013 $ 28,566 $ 2,641 $ 831
1 Includes assets held for sale.
2 2003 and 2002 reclassified to conform to 2004 presentation.
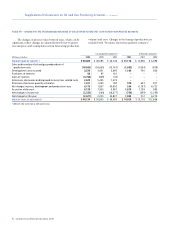
Supplemental Information on Oil and Gas Producing Activities – Continued
TABLE II – CAPITALIZED COSTS RELATED TO OIL AND GAS PRODUCING ACTIVITIES1 – Continued