Chevron 2004 Annual Report Download - page 54
Download and view the complete annual report
Please find page 54 of the 2004 Chevron annual report below. You can navigate through the pages in the report by either clicking on the pages listed below, or by using the keyword search tool below to find specific information within the annual report.-
 1
1 -
2
-
3
-
4
-
5
-
6
-
7
-
8
-
9
-
10
-
11
-
12
-
13
-
14
-
15
-
16
-
17
-
18
-
19
-
20
-
21
-
22
-
23
-
24
-
25
-
26
-
27
-
28
-
29
-
30
-
31
-
32
-
33
-
34
-
35
-
36
-
37
-
38
-
39
-
40
-
41
-
42
-
43
-
 44
44 -
 45
45 -
 46
46 -
 47
47 -
 48
48 -
 49
49 -
 50
50 -
 51
51 -
 52
52 -
 53
53 -
 54
54 -
 55
55 -
 56
56 -
 57
57 -
 58
58 -
 59
59 -
 60
60 -
 61
61 -
 62
62 -
 63
63 -
 64
64 -
65
-
66
-
67
-
68
-
69
-
70
-
71
-
72
-
73
-
74
-
75
-
76
-
77
-
78
-
79
-
80
-
81
-
82
-
83
-
84
-
85
-
86
-
87
-
88
-
89
-
90
-
91
-
92
-
93
-
94
-
95
-
96
-
97
-
98
 |
 |

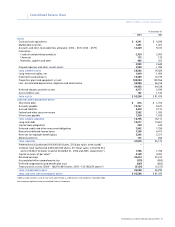
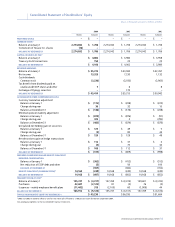
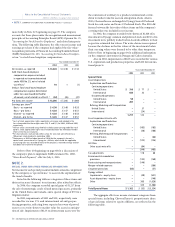
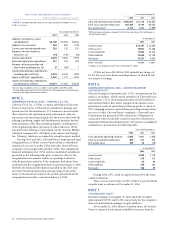
52 CHEVRONTEXACO CORPORATION 2004 ANNUAL REPORT
Consolidated Statement of Cash Flows
Millionsofdollars
Year ended December 31
2003 2002
Net income $ 7,230 $ 1,132
Adjustments
Depreciation, depletion and amortization 5,326 5,169
Dry hole expense 256 288
Distributions (less) more than income from equity affiliates (383) 510
Net before-tax gains on asset retirements and sales (194) (33)
Net foreign currency effects 199 5
Deferred income tax provision 164 (81)
Net decrease in operating working capital 162 1,125
Minority interest in net income 80 57
Cumulative effect of changes in accounting principles 196 –
Gain from exchange of Dynegy preferred stock (365) –
Write-down of investments in Dynegy, before tax – 1,796
(Increase) decrease in long-term receivables 12 (39)
(Increase) decrease in other deferred charges 1,646 428
Cash contributions to employee pension plans (1,417) (246)
Other (597) (168)
12,315 9,943
Capital expenditures (5,625) (7,597)
Advances to equity affiliate – –
Repayment of loans by equity affiliates 293 –
Proceeds from asset sales 1,107 2,341
Net (purchases) sales of marketable securities 153 209
(4,072) (5,047)
Net borrowings (payments) of short-term obligations (3,628) (1,810)
Proceeds from issuances of long-term debt 1,034 2,045
Repayments of long-term debt and other financing obligations (1,347) (1,356)
Cash dividends – common stock (3,033) (2,965)
Dividends paid to minority interests (37) (26)
Net (purchases) sales of treasury shares 57 41
Redemption of preferred stock of subsidiaries (75) –
(7,029) (4,071)
95 15
1,309 840
2,957 2,117
$ 4,266 $ 2,957
See accompanying Notes to the Consolidated Financial Statements.