Chevron 2004 Annual Report Download - page 33
Download and view the complete annual report
Please find page 33 of the 2004 Chevron annual report below. You can navigate through the pages in the report by either clicking on the pages listed below, or by using the keyword search tool below to find specific information within the annual report.-
 1
1 -
2
-
3
-
4
-
5
-
6
-
7
-
8
-
9
-
10
-
11
-
12
-
13
-
14
-
15
-
16
-
17
-
18
-
19
-
20
-
21
-
22
-
 23
23 -
 24
24 -
 25
25 -
 26
26 -
 27
27 -
 28
28 -
 29
29 -
 30
30 -
 31
31 -
 32
32 -
 33
33 -
 34
34 -
 35
35 -
 36
36 -
 37
37 -
 38
38 -
 39
39 -
 40
40 -
 41
41 -
 42
42 -
 43
43 -
44
-
45
-
46
-
47
-
48
-
49
-
50
-
51
-
52
-
53
-
54
-
55
-
56
-
57
-
58
-
59
-
60
-
61
-
62
-
63
-
64
-
65
-
66
-
67
-
68
-
69
-
70
-
71
-
72
-
73
-
74
-
75
-
76
-
77
-
78
-
79
-
80
-
81
-
82
-
83
-
84
-
85
-
86
-
87
-
88
-
89
-
90
-
91
-
92
-
93
-
94
-
95
-
96
-
97
-
98
 |
 |
CHEVRONTEXACO CORPORATION 2004 ANNUAL REPORT 31
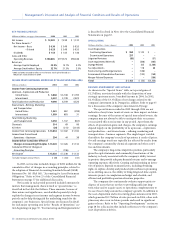
Incomefromcontinuingoperationsin2004ofnearly
$3.9billionwasabout$700millionhigherthanin2003.
Nearly$400millionoftheincreaserepresentedthedifference
intheeffectonearningsintherespectiveperiodsfromspecial
items,whicharediscussedbelow.Theremaining$300million
improvementwascomposedofabouta$1billionbenefitfrom
highercrudeoilandnaturalgaspricesthatwaslargelyoffsetby
theeffectsoflowerproduction.
Incomefromcontinuingoperationsin2003wasabout
$3.2billion,upapproximately$1.5billionfrom2002.Thebenefit
ofhigherpricesbetweenperiodswasabout$1.7billionandwas
partiallyoffsetbytheeffectoflowerproduction.
Thecompany’saverageliquidsrealizationin2004was
$34.12perbarrel,comparedwith$26.66in2003and$21.34in
2002.Theaveragenaturalgasrealizationwas$5.51perthousand
cubicfeetin2004,comparedwith$5.01and$2.89in2003and
2002,respectively.
Netoil-equivalentproductionaveraged817,000barrelsper
dayin2004,down12percentfrom2003and19percentfrom2002.
Thelowerproductionin2004includedtheeffectsofabout30,000
barrelsperdayassociatedwithpropertysalesand21,000barrels
perdayofproductionshutinasaresultofdamagestofacilities
fromHurricaneIvaninthethirdquarter.Adjustingfortheeffects
ofpropertysalesandstormsinallperiodspresented,oil-equiva-
lentproductionin2004declinedabout7percentfrom2003and
14percentfrom2002,mainlyasaresultofnormalfielddeclines
thatdonottypicallyreverse.
Thenetliquidscomponentofoil-equivalentproductionfor
2004averaged505,000barrelsperday,adeclineof10percent
from2003and16percentfrom2002.Excludingtheeffectsof
propertysalesandstorms,netliquidsproductionin2004declined
5percentand11percentfrom2003and2002,respectively.
Netnaturalgasproductionaveraged1.9billioncubicfeet
perdayin2004,16percentlowerthan2003and22percentlower
than2002.Adjustingfortheeffectsofpropertysalesandstorms,
2004netnaturalgasproductiondeclined10percentin2003and
17percentin2002.
Refertothe“SelectedOperatingData”tableonpage34forthe
three-yearcomparativeproductionvolumesintheUnitedStates.
Segmentincomein2004includedspecialgainsof$366
millionfrompropertysales,partiallyoffsetbyspecialcharges
of$55millionresultingfromanadverselitigationmatter.Net
specialchargesof$64millionin2003werecomposedofcharges
of$103millionforassetimpairments,associatedmainlywiththe
write-downofassetsinanticipationofsale;chargesof$38mil-
lionforrestructuringandreorganization,mainlyforemployee
severancecosts;andgainsof$77millionfrompropertysales.
Specialchargesin2002totaled$214million,whichincluded
$183millionfortheimpairmentofanumberoffieldscausedby
thewrite-downofprovedreservesand$31millionforcostsof
environmentalremediation.
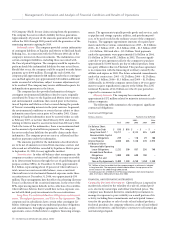
InternationalUpstream–ExplorationandProduction
Millionsofdollars 2003 2002
Income From Continuing Operations1 $ 3,199 $ 2,823
Income From Discontinued Operations 21 16
Cumulative Effect of Accounting
Change 145 –
$ 3,365 $ 2,839
1 Includes Foreign Currency Effects: $ (319) $ 90
2 Includes Special-Item Gains (Charges):
Asset Dispositions
Continuing Operations $ 32 $ –
Discontinued Operations – –
Asset Impairments/Write-offs (30) (100)
Restructuring and Reorganizations (22) –
Tax Adjustments 118 (37)
Total $ 98 $ (137)
Incomefromcontinuingoperationsof$5.6billionin2004
increasedabout$2.4billionfrom2003.Approximately$1.1bil-
lionoftheincreasewasassociatedwithhigherpricesforcrude
oilandnaturalgas.Approximately$750millionoftheincrease
wastheresultoftheeffectsofspecialitemsineachperiod,which
arediscussedbelow.Another$400millionresultedfromlower
income-taxexpensebetweenperiods,includingabenefitofabout
$200millionin2004asaresultofchangesinincometaxlaws.
Otherwise,thebenefitofabout$200millioninlowerforeigncur-
rencylosseswaslargelyoffsetbyhighertransportationcosts.
Incomefromcontinuingoperationsof$3.2billionin2003
wasnearly$400millionhigherthanin2002.Highercrudeoil
andnaturalgaspricesaccountedforanincreaseofabout$900mil-
lion,whichwaspartiallyoffsetby$400millionfromtheeffect
offoreigncurrencychangesandabout$100millionofhigher
incometax-expense.
Netoil-equivalentproductionof1.7millionbarrelsperday
in2004–includingotherproducedvolumesof140,000netbar-
relsperdayfromoilsandsandproductionunderanoperating
serviceagreement–declinedabout1percentfrom2003and
2percentfrom2002.Excludingthelowerproductionassociated
withpropertysalesandreducedvolumesassociatedwithcost-
recoveryprovisionsofcertainproduction-sharingagreements,
2004netoil-equivalentproductionincreasednearly3percent
from2003and1percentfrom2002–primarilyfromhigheroil-
equivalentproductioninChad,KazakhstanandVenezuela.
Thenetliquidscomponentofoil-equivalentproduction,
includingvolumesproducedfromoilsandsandunderanoperating
serviceagreement,declinedabout1percentfromtheproduc-
tionlevelin2003andabout3percentfrom2002.Excluding
theeffectsofpropertysalesandlowercost-recoveryvolumes
undercertainproduction-sharingagreements,2004netliquids
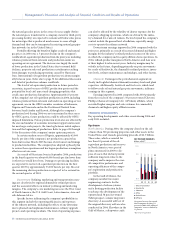
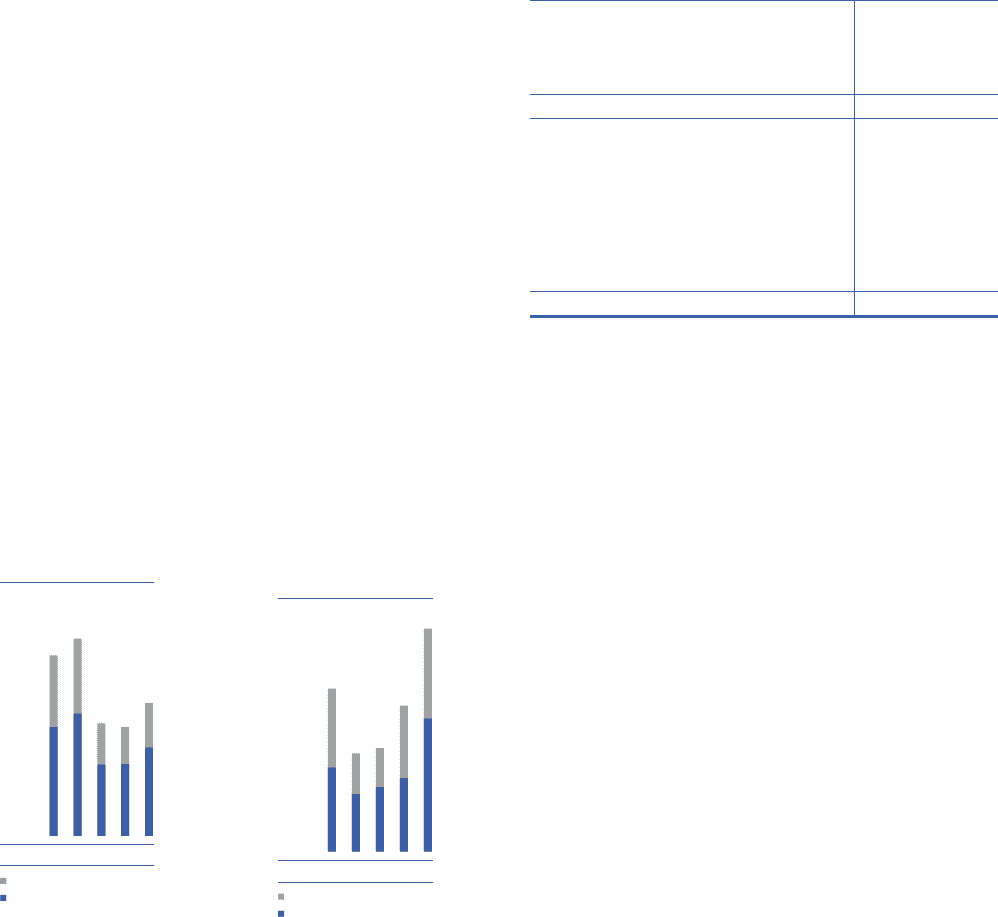
0
1200
900
600
300
0100 02 03
Millions of dollars
United States
International
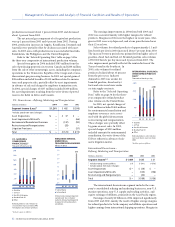
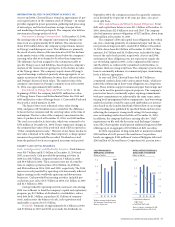
Explorationexpensesdeclined
aftertheOctober2001merger,
reflecting,inpart,thehigh-
gradingofthecombinedexplo-
rationportfolio.
0.0
10.0
8.0
6.0
4.0
2.0
0100 02 03
Billions of dollars
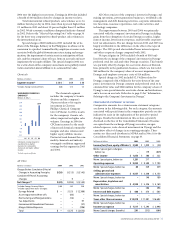
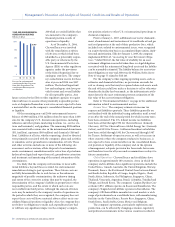
Earningsincreasedsignificantly
in2004onhigherpricesfor
crudeoilandnaturalgas.Par-
tiallyoffsettingweretheeffects
oflowerproductionvolumes.
�Beforethecumulativeeffectof
changesinaccountingprinciples
butincludingdiscontinued
operations
United States
International