Chevron 2004 Annual Report Download - page 66
Download and view the complete annual report
Please find page 66 of the 2004 Chevron annual report below. You can navigate through the pages in the report by either clicking on the pages listed below, or by using the keyword search tool below to find specific information within the annual report.-
 1
1 -
2
-
3
-
4
-
5
-
6
-
7
-
8
-
9
-
10
-
11
-
12
-
13
-
14
-
15
-
16
-
17
-
18
-
19
-
20
-
21
-
22
-
23
-
24
-
25
-
26
-
27
-
28
-
29
-
30
-
31
-
32
-
33
-
34
-
35
-
36
-
37
-
38
-
39
-
40
-
41
-
42
-
43
-
44
-
45
-
46
-
47
-
48
-
49
-
50
-
51
-
52
-
53
-
54
-
55
-
 56
56 -
 57
57 -
 58
58 -
 59
59 -
 60
60 -
 61
61 -
 62
62 -
 63
63 -
 64
64 -
 65
65 -
 66
66 -
 67
67 -
 68
68 -
 69
69 -
 70
70 -
 71
71 -
 72
72 -
 73
73 -
 74
74 -
 75
75 -
 76
76 -
77
-
78
-
79
-
80
-
81
-
82
-
83
-
84
-
85
-
86
-
87
-
88
-
89
-
90
-
91
-
92
-
93
-
94
-
95
-
96
-
97
-
98
 |
 |

64 CHEVRONTEXACO CORPORATION 2004 ANNUAL REPORT
ofnaturalgas,andthefractionation,storage,transportationand
marketingofnaturalgasliquids.Thecompanyalsoholdsinvest-
mentsinDynegypreferredstock.
Investment in Dynegy Common Stock AtDecember31,2004,
thecarryingvalueofthecompany’sinvestmentinDynegycom-
monstockwasapproximately$150.Thisamountwasabout
$365belowthecompany’sproportionateinterestinDynegy’s
underlyingnetassets.Thisdifferenceisprimarilytheresultof
write-downsoftheinvestmentin2002fordeclinesinthemarket
valueofthecommonsharesbelowthecompany’scarryingvalue
thatweredeemedtobeotherthantemporary.Thisdifference
hasbeenassignedtotheextentpracticabletospecificDynegy
assetsandliabilities,baseduponthecompany’sanalysisofthe
variousfactorscontributingtothedeclineinvalueoftheDynegy
shares.Thecompany’sequityshareofDynegy’sreportedearnings
isadjustedquarterlywhenappropriatetoreflectthedifference
betweentheseallocatedvaluesandDynegy’shistoricalbookval-
ues.Themarketvalueofthecompany’sinvestmentinDynegy’s
commonstockatDecember31,2004,wasapproximately$450.
Investments in Dynegy Notes and Preferred Stock Referto
Note8,page60,foradiscussionoftheseinvestments.
OtherInformation “Salesandotheroperatingrevenues”on
theConsolidatedStatementofIncomeincludes$7,933,$6,308
and$6,522withaffiliatedcompaniesfor2004,2003and2002,
respectively.“Purchasedcrudeoilandproducts”includes$2,548,
$1,740and$1,839withaffiliatedcompaniesfor2004,2003and
2002,respectively.
“Accountsandnotesreceivable”ontheConsolidatedBalance
Sheetincludes$1,188and$827duefromaffiliatedcompaniesat
December31,2004and2003,respectively.“Accountspayable”
includes$192and$118duetoaffiliatedcompaniesatDecember
31,2004and2003,respectively.
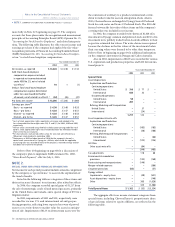
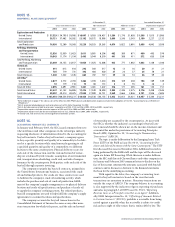
Thefollowingtableprovidessummarizedfinancialinfor-
mationona100percentbasisforallequityaffiliates,aswellas
ChevronTexaco’stotalshare.
maturity,andthe$1,800distributionwererecordedto“Invest-
mentsandAdvances.”
LG-CaltexOilCorporation ChevronTexacoowns50percentof
LG-Caltex,ajointventureformedin1967betweentheLGGroup
andCaltextoengageinimporting,refiningandmarketingof
petroleumproductsandpetrochemicalsinSouthKorea.
StarPetroleumRefiningCompanyLtd. ChevronTexacohasa
64percentequityownershipinterestinStarPetroleumRefining
CompanyLimited(SPRC),whichownstheStarRefineryat
MapTaPhut,Thailand.ThePetroleumAuthorityofThailand
ownstheremaining36percentofSPRC.
CaltexAustraliaLtd. ChevronTexacohasa50percentequity
ownershipinterestinCaltexAustraliaLimited(CAL).The
remaining50percentofCALispubliclyowned.During2002,
thecompanywrotedownitsinvestmentinCALby$136toits
estimatedfairvalueatSeptember30,2002.AtDecember31,
2004,thefairvalueofChevronTexaco’sshareofCALcommon
stockwas$1,130.Theaggregatecarryingvalueofthecompany’s
investmentinCALwasapproximately$80lowerthanthe
amountofunderlyingequityinCALnetassets.
ChevronPhillipsChemicalCompanyLLC ChevronTexacoowns
50percentofCPChem,formedin2000whenChevronmerged
mostofitspetrochemicalsbusinesseswiththoseofPhillipsPetro-
leumCompany.AtDecember31,2004,thecompany’scarrying
valueofitsinvestmentinCPChemwasapproximately$130lower
thantheamountofunderlyingequityinCPChem’snetassets.
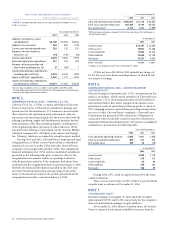
DynegyInc. ChevronTexacoownsanapproximate25percent
equityinterestinthecommonstockofDynegy,anenergypro-
viderengagedinpowergeneration,thegatheringandprocessing
Notes to the Consolidated Financial Statements
Millionsofdollars,exceptper-shareamounts
INVESTMENTS AND ADVANCES – Continued
Affiliates ChevronTexaco Share*
YearendedDecember31 2003 2002 2003 2002
Total revenues $ 42,323 $ 31,877 $ 19,467 $ 15,049
Income (loss) before
income tax expense 1,657 (1,517) 1,211 70
Net income (loss) 1,508 (1,540) 1,029 (25)
Current assets $ 12,204 $ 16,808 $ 5,180 $ 6,270
Noncurrent assets 39,422 40,884 15,765 15,219
Current liabilities 9,642 14,414 4,132 5,158
Noncurrent liabilities 22,738 24,129 5,002 5,668
$ 19,246 $ 19,149 $ 11,811 $ 10,663
*
The company’s share of income and underlying equity in the net assets of its investments includes the effects of write-downs of certain investments, largely related to Dynegy Inc.
and Caltex Australia Limited, as described in the preceding section.