Chevron 2004 Annual Report Download - page 74
Download and view the complete annual report
Please find page 74 of the 2004 Chevron annual report below. You can navigate through the pages in the report by either clicking on the pages listed below, or by using the keyword search tool below to find specific information within the annual report.-
 1
1 -
2
-
3
-
4
-
5
-
6
-
7
-
8
-
9
-
10
-
11
-
12
-
13
-
14
-
15
-
16
-
17
-
18
-
19
-
20
-
21
-
22
-
23
-
24
-
25
-
26
-
27
-
28
-
29
-
30
-
31
-
32
-
33
-
34
-
35
-
36
-
37
-
38
-
39
-
40
-
41
-
42
-
43
-
44
-
45
-
46
-
47
-
48
-
49
-
50
-
51
-
52
-
53
-
54
-
55
-
56
-
57
-
58
-
59
-
60
-
61
-
62
-
63
-
 64
64 -
 65
65 -
 66
66 -
 67
67 -
 68
68 -
 69
69 -
 70
70 -
 71
71 -
 72
72 -
 73
73 -
 74
74 -
 75
75 -
 76
76 -
 77
77 -
 78
78 -
 79
79 -
 80
80 -
 81
81 -
 82
82 -
 83
83 -
 84
84 -
85
-
86
-
87
-
88
-
89
-
90
-
91
-
92
-
93
-
94
-
95
-
96
-
97
-
98
 |
 |

72 CHEVRONTEXACO CORPORATION 2004 ANNUAL REPORT
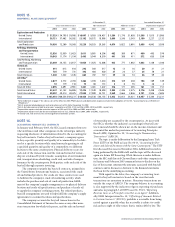
Thecomponentsofnetperiodicbenefitcostfor2004,2003and2002were:
Pension Benefits
2003 2002 Other Benefits
U.S. Int’l. U.S. Int’l. U.S. Int’l. 2003 2002
Service cost $ 144 $ 54 $ 112 $ 47 $ 28 $ 25
Interest cost 334 151 334 143 191 178
Expected return on plan assets (224) (132) (288) (138) – –
Amortization of transitional assets – (3) – (3) – –
Amortization of prior-service costs 45 14 32 12 (3) (3)
Recognized actuarial losses (gains) 133 42 32 27 12 (1)
Settlement losses 132 1 146 1 – –
Curtailment losses – 6 – – – – –
Special termination benefits
recognition – – – – – –
Net periodic benefit cost $ 564 $ 133 $ 368 $ 89 $ 228 $ 199
Assumptions Thefollowingweightedaverageassumptionswereusedtodeterminebenefitobligationsandnetperiodbenefitcostsforyears
endedDecember31:
Pension Benefits
2003 2002 Other Benefits
U.S. Int’l. U.S. Int’l. U.S. Int’l. 2003 2002
Assumptions used to determine
benefit obligations
Discount rate 6.0% 6.8% 6.8% 7.1% 6.1% 6.8%
Rate of compensation increase 4.0% 4.9% 4.0% 5.5% 4.1% 4.1%
Assumptions used to determine
net periodic benefit cost
Discount rate* 6.3% 7.1% 7.4% 7.7% 6.8% 7.3%
Expected return on plan assets* 7.8% 8.3% 8.3% 8.9% N/A N/A
Rate of compensation increase 4.0% 5.1% 4.0% 5.4% 4.1% 4.1%
* Discount rate and expected rate of return on plan assets were reviewed and updated as needed on a quarterly basis for the main U.S. pension plan.
ExpectedReturnonPlanAssets Thecompanyemploysarigorous
processtodeterminetheestimatesoflong-termrateofreturn
onpensionassets.Theseestimatesareprimarilydrivenbyactual
historicalasset-classreturns,anassessmentofexpectedfuture
performanceandadvicefromexternalactuarialfirmswhile
incorporatingspecificasset-classriskfactors.Assetallocationsare
regularlyupdatedusingpensionplanasset/liabilitystudies,and
thedeterminationofthecompany’sestimatesoflong-termrates
ofreturnareconsistentwiththesestudies.
Therehavebeennochangesintheexpectedlong-termrate
ofreturnonplanassetssince2002forU.S.plans,whichaccount
forabout70percentofthecompany’spensionplanassets.At
December31,2004,theestimatedlong-termrateofreturnon
U.S.pensionplanassetswas7.8percent.
Theyear-endmarket-relatedvalueofU.S.pensionplan
assetsusedinthedeterminationofpensionexpensewasbasedon
themarketvaluesintheprecedingthreemonths,asopposedto
themaximumallowableperiodoffiveyearsunderU.S.accounting
rules.Managementconsidersthethree-monthtimeperiodlong
enoughtominimizetheeffectsofdistortionsfromday-to-day
marketvolatilityandyetstillbecontemporaneoustotheendof
theyear.ForplansoutsidetheU.S.,marketvalueofassetsasof
themeasurementdateisusedincalculatingthepensionexpense.
Notes to the Consolidated Financial Statements
Millionsofdollars,exceptper-shareamounts
EMPLOYEE BENEFIT PLANS – Continued
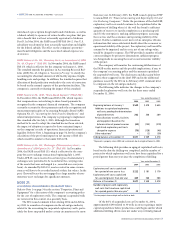
OtherBenefitAssumptions EffectiveJanuary1,2005,thecom-
panyamendeditsmainU.S.postretirementmedicalplantolimit
futureincreasesinthecompanycontribution.Forcurrentretirees,
theincreaseincompanycontributioniscappedat4percenteach
year.Forfutureretirees,the4percentcapwillbeeffectiveat
retirement.Beforeretirement,theassumedhealthcarecosttrend
ratesstartwith10.6percentin2004andgraduallydropto4.8
percentfor2010andbeyond.Oncetheemployeeelectstoretire,
thetrendratesarecappedat4percent.
Forthemeasurementofaccumulatedpostretirementbenefit
obligationatDecember31,2003,theassumedheathcarecost
trendratesstartwith8.4percentin2003andgraduallydecline
to4.5percentfor2007andbeyond.
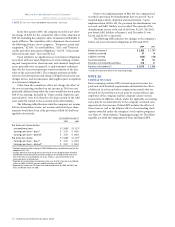
Assumedhealthcarecost-trendrateshaveasignificanteffect
ontheamountsreportedforretireehealthcarecosts.Achangeof
onepercentagepointintheassumedhealthcarecost-trendrates
wouldhavethefollowingeffects: