Chevron 2004 Annual Report Download - page 29
Download and view the complete annual report
Please find page 29 of the 2004 Chevron annual report below. You can navigate through the pages in the report by either clicking on the pages listed below, or by using the keyword search tool below to find specific information within the annual report.-
 1
1 -
2
-
3
-
4
-
5
-
6
-
7
-
8
-
9
-
10
-
11
-
12
-
13
-
14
-
15
-
16
-
17
-
18
-
 19
19 -
 20
20 -
 21
21 -
 22
22 -
 23
23 -
 24
24 -
 25
25 -
 26
26 -
 27
27 -
 28
28 -
 29
29 -
 30
30 -
 31
31 -
 32
32 -
 33
33 -
 34
34 -
 35
35 -
 36
36 -
 37
37 -
 38
38 -
 39
39 -
40
-
41
-
42
-
43
-
44
-
45
-
46
-
47
-
48
-
49
-
50
-
51
-
52
-
53
-
54
-
55
-
56
-
57
-
58
-
59
-
60
-
61
-
62
-
63
-
64
-
65
-
66
-
67
-
68
-
69
-
70
-
71
-
72
-
73
-
74
-
75
-
76
-
77
-
78
-
79
-
80
-
81
-
82
-
83
-
84
-
85
-
86
-
87
-
88
-
89
-
90
-
91
-
92
-
93
-
94
-
95
-
96
-
97
-
98
 |
 |
CHEVRONTEXACO CORPORATION 2004 ANNUAL REPORT 27
Commentsrelatedtoearningstrendsforthecompany’s
majorbusinessareasareasfollows:
Upstream Year-to-yearchangesinexplorationandproduc-
tionearningsalignmostcloselywithindustrypricelevelsfor
crudeoilandnaturalgas.Crudeoilandnaturalgaspricesare
subjecttoexternalfactorsoverwhichthecompanyhasnocon-
trol,includingproductdemandconnectedwithglobaleconomic
conditions,industryinventorylevels,productionquotasimposed
bytheOrganizationofPetroleumExportingCountries(OPEC),
weather-relateddamagesanddisruptions,competingfuelprices,
andregionalsupplyinterruptionsthatmaybecausedbymilitary
conflicts,civilunrestorpoliticaluncertainty.Moreover,anyof
thesefactorscouldalsoinhibitthecompany’sproductioncapacity
inanaffectedregion.Thecompanymonitorsdevelopments
closelyinthecountriesinwhichitoperatesandholdsinvest-
mentsandattemptstomanagerisksinoperatingitsfacilities
andbusiness.Longer-termtrendsinearningsforthissegment
arealsoafunctionofotherfactorsbesidespricefluctuations,
includingchangesinthecompany’scrudeoilandnaturalgas
productionlevelsandthecompany’sabilitytofindoracquire
andefficientlyproducecrudeoilandnaturalgasreserves.
Thelevelofoperatingexpensesassociatedwiththeefficient
productionofoilandgascanalsobesubjecttoexternalfactors
beyondthecompany’scontrol.Externalfactorsincludenotonly
thegenerallevelofinflationbutalsopriceschargedbytheindus-
try’sproduct-andservice-providers,whichcanbeaffectedbythe
volatilityoftheindustry’sownsupplyanddemandconditions
forsuchproductsandservices.Operatingexpensescanalsobe
affectedbyuninsureddamagestoproductionfacilitiescausedby
severeweatherorcivilunrest.
Industrypricelevelsforcrudeoilreachedrecordhighsdur-
ing2004.Forexample,thepriceforWestTexasIntermediate
(WTI)crudeoil,oneofthebenchmarkcrudes,reached$55per
barrelinOctober2004.WTIpricesforthefullyearaveraged
$41perbarrel,anincreaseofapproximately$10perbarrelfrom
2003.TheWTIspotpriceperbarrelattheendofFebruary2005
wasapproximately$51.Theserelativelyhighindustryprices
reflected,amongotherthings,increaseddemandfromhigher
economicgrowth,particularlyinAsiaandtheUnitedStates,the
heightenedlevelofgeopoliticaluncertaintyinmanyareasofthe
world,crudeoilsupplyconcernsintheMiddleEastandother
keyproducingregions,andproductionshutinforrepairsfollow-
ingHurricaneIvanintheGulfofMexicoinSeptember2004.
Duringmostof2004,thedifferentialinpricesbetween
highquality,light-sweetcrudeoils,suchastheU.S.benchmark
WTI,andtheheaviercrudeswasunusuallywide.Theupward
trendinpricesin2004forlightercrudeoilstrackedtheincreased
demandforlightproducts,asallrefineriescouldprocessthese
higherqualitycrudes.However,thedemandandpriceforthe
heaviercrudesweredampenedduetothelimitednumberof
refineriesthatareabletoprocessthislowerqualityfeedstock.
Thecompanyproducesheavycrudeoil(includingvolumes
underanoperatingserviceagreement)inCalifornia,Indonesia,
thePartitionedNeutralZone(betweenSaudiArabiaandKuwait)
andVenezuela.
Naturalgasprices,particularlyintheUnitedStates,werealso
higherin2004thanin2003.Benchmarkpricesin2004forHenry
HubU.S.naturalgaspeakedinOctober2004above$8.50per
thousandcubicfeet(MCF).Forthefullyear,pricesaveragednearly
$6.00perMCF,comparedwith$5.50in2003.AttheendofFebru-
ary2005,theHenryHubspotpricewasabout$6.10perMCF.
Ascomparedwiththesupplyanddemandfactorsfornatural
gasintheUnitedStatesandtheresultanttrendintheHenryHub
benchmarkprices,certainotherregionsoftheworldinwhich
thecompanyoperateshavesignificantlydifferentsupply,demand
andregulatorycircumstances,typicallyresultinginsignificantly
loweraveragesalespricesforthecompany’sproductionofnatu-
ralgas.(Refertothetableonpage34forthecompany’saverage
naturalgaspricesfortheUnitedStatesandinternationalregions.)
Additionally,excesssupplyconditionsthatexistincertainparts
oftheworldcannoteasilyservetomitigatetherelativelyhigh-
priceconditionsintheUnitedStatesandotherdevelopedmarkets
becauseoflackofinfrastructureandthedifficultiesintransporting
naturalgas.
Tohelpaddressthisregionalimbalancebetweensupplyand
demandfornaturalgas,ChevronTexacoandothercompanies
intheindustryareplanningincreasedinvestmentsinlong-
termprojectsinareasofexcesssupplytoinstallinfrastructure
toproduceandliquefynaturalgasfortransportbytankerand
additionalinvestmenttoregasifytheproductinmarketswhere
demandisstrongandsuppliesarenotasplentiful.Duetothe
significanceoftheoverallinvestmentintheselong-termprojects,
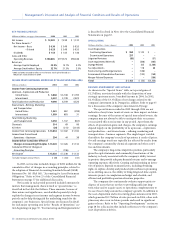
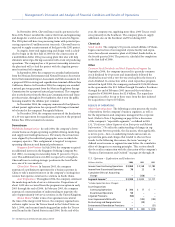
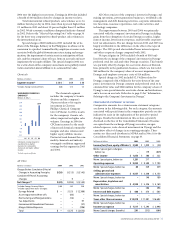
Dollars per barrel
86 87 88 89 90 91 92 93 94 95 96 97 98 99 00 0301 02 05
10
50
40
30
20
TheaveragespotpriceofWestTexasIntermediate,abenchmarkcrudeoil,rose
55percentfromthefourthquarterof2003tothefourthquarterof2004.
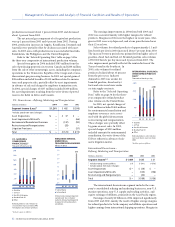
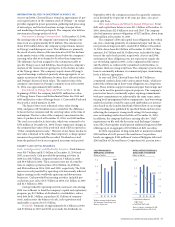
0
3500
2800
700
1400
2100
0.00
7.50
6.00
4.50
3.00
1.50
0100 02 03
Prices in Dollars per Thousand
Cubic Feet (right scale)
Production in Millions of
Cubic Feet per Day (left scale)
Averagepricesclimbed10per-
centduring2004.Productionwas
down16percentduetoassetsales,
theeffectsofstormsintheU.S.
GulfofMexicoandnormalfield
declines.
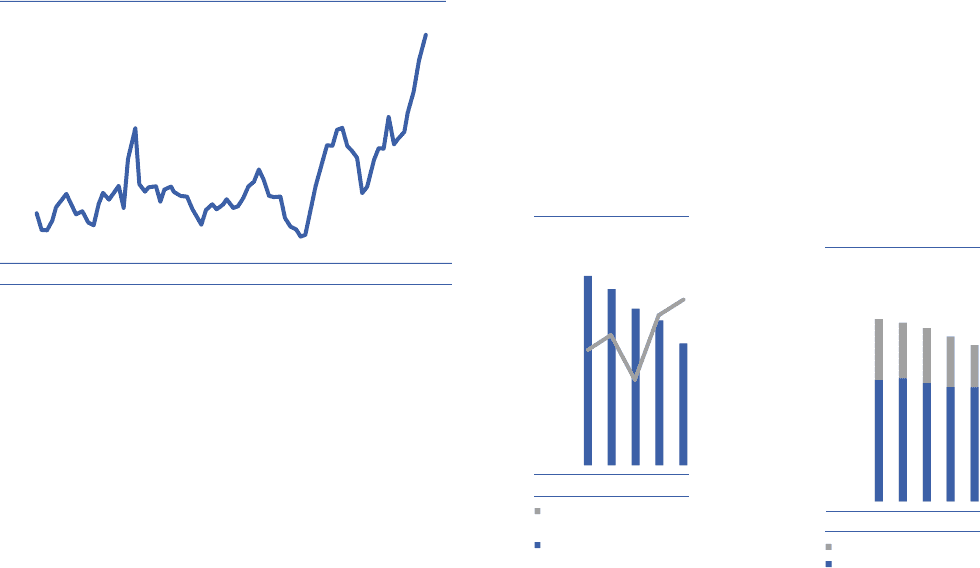
0
2500
2000
1500
1000
500
0100 02 03
Thousands of barrels per day
United States
International
Netliquidsproductiondeclined
about5percentin2004,mainly
causedbyassetsalesandthe
effectsofstorms.
�Includesequityinaffiliates
(back) – v5