Chevron 2004 Annual Report Download - page 58
Download and view the complete annual report
Please find page 58 of the 2004 Chevron annual report below. You can navigate through the pages in the report by either clicking on the pages listed below, or by using the keyword search tool below to find specific information within the annual report.-
 1
1 -
2
-
3
-
4
-
5
-
6
-
7
-
8
-
9
-
10
-
11
-
12
-
13
-
14
-
15
-
16
-
17
-
18
-
19
-
20
-
21
-
22
-
23
-
24
-
25
-
26
-
27
-
28
-
29
-
30
-
31
-
32
-
33
-
34
-
35
-
36
-
37
-
38
-
39
-
40
-
41
-
42
-
43
-
44
-
45
-
46
-
47
-
 48
48 -
 49
49 -
 50
50 -
 51
51 -
 52
52 -
 53
53 -
 54
54 -
 55
55 -
 56
56 -
 57
57 -
 58
58 -
 59
59 -
 60
60 -
 61
61 -
 62
62 -
 63
63 -
 64
64 -
 65
65 -
 66
66 -
 67
67 -
 68
68 -
69
-
70
-
71
-
72
-
73
-
74
-
75
-
76
-
77
-
78
-
79
-
80
-
81
-
82
-
83
-
84
-
85
-
86
-
87
-
88
-
89
-
90
-
91
-
92
-
93
-
94
-
95
-
96
-
97
-
98
 |
 |

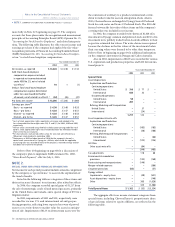
56 CHEVRONTEXACO CORPORATION 2004 ANNUAL REPORT
morefullyinNote22beginningonpage70.Thecompany
accountsforthoseplansundertherecognitionandmeasurement
principlesofAccountingPrinciplesBoard(APB)OpinionNo.25,
“AccountingforStockIssuedtoEmployees,”andrelatedinterpreta-
tions.Thefollowingtableillustratestheeffectonnetincomeand
earningspershareifthecompanyhadappliedthefair-value-
recognitionprovisionsofFinancialAccountingStandardsBoard
(FASB)StatementNo.123,“AccountingforStock-BasedCompen-
sation,”tostock-basedemployeecompensation:
Year ended December 31
2003 2002
Net income, as reported $ 7,230 $ 1,132
Add: Stock-based employee
compensation expense included
in reported net income determined
under APB No. 25, net of related
tax effects1 1 (1)
Deduct: Total stock-based employee
compensation expense determined
under fair-value-based method for
all awards, net of related tax effects1,2 (26) (47)
Pro forma net income $ 7,205 $ 1,084
Earnings per share3,4
Basic – as reported $ 3.48 $ 0.53
Basic – pro forma $ 3.47 $ 0.51
Diluted – as reported $ 3.48 $ 0.53
Diluted – pro forma $ 3.47 $ 0.51
1 Costs of stock appreciation rights reported in net income and included in the
fair-value method for these rights were $10, $1 and $(1) for 2004, 2003 and 2002,
respectively.
2 The fair value is estimated using the Black-Scholes option-pricing model for stock
options. Stock appreciation rights are estimated based on the method outlined in
SFAS 123 for these instruments.
3 Per-share amounts in all periods reflect a two-for-one stock split effected as a
100 percent stock dividend in September 2004.
4 The amounts in 2003 include a benefit of $0.08 for the company’s share of a
capital stock transaction of its Dynegy Inc. affiliate, which under the applicable
accounting rules was recorded directly to the company’s retained earnings and not
included in net income for the period.
RefertoNote20beginningonpage68foradiscussionof
thecompany’splantoimplementFASBstatementNo.123R,
“Share-BasedPayment,”effectiveJuly1,2005.
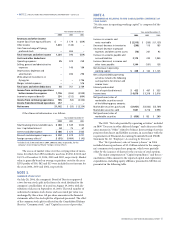
Netincomeforeachperiodpresentedincludesamountscategorized
bythecompanyas“specialitems,”toassistintheexplanationof
thetrendofresults.
Listedinthefollowingtablearecategoriesoftheseitemsand
theirnetincrease(decrease)tonetincome,afterrelatedtaxeffects.
In2004,thecompanyrecordedspecialgainsof$1,217from
thesaleofnonstrategiccrudeoilandnaturalgasassets,primarily
intheUnitedStatesandCanada,andaspecialchargeof$55fora
litigationmatter.
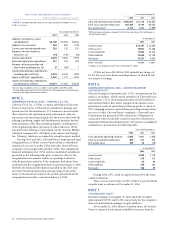
In2003,impairmentsof$103and$30,respectively,were
recordedforvariousU.S.andinternationaloilandgaspro-
ducingproperties,reflectinglowerexpectedrecoveryofproved
reservesorawrite-downtomarketvalueforassetsinanticipa-
tionofsale.Impairmentsof$123ondownstreamassetswerefor
theconversionofarefinerytoaproductsterminalandawrite-
downtomarketvalueforassetsinanticipationofsale.Alsoin
2003,ChevronTexacoexchangeditsDynegySeriesBPreferred
Stockforcash,notesandSeriesCPreferredStock.The$365dif-
ferencebetweenthefairvalueoftheseitemsandthecompany’s
carryingvaluewasincludedinnetincome.
In2002,thecompanyrecordedwrite-downsof$1,626ofits
investmentinDynegycommonandpreferredstockand$136ofits
investmentinitspubliclytradedCaltexAustraliaaffiliatetotheir
respectiveestimatedfairvalues.Thewrite-downswererequired
becausethedeclinesinthefairvaluesoftheinvestmentsbelow
theircarryingvaluesweredeemedtobeotherthantemporary.
RefertoNote14beginningonpage63foradditionalinformation
onthecompany’sinvestmentinDynegyandCaltexAustralia.
Alsoin2002,impairmentsof$183wererecordedforvarious
U.S.explorationandproductionpropertiesand$100forinterna-
tionalprojects.
Year ended December 31
2003 2002
Asset dispositions
Exploration and Production
Continuing operations
United States $ 77 $ –
International 32 –
Discontinued operations
United States – –
International – –
Refining, Marketing and Transportation
United States 37 –
International (24) –
122 –
Asset impairments/write-offs
Exploration and Production
Continuing operations
United States (103) (183)
International (30) (100)
Refining, Marketing and Transportation
United States – (66)
International (123) (136)
All Other
Other asset write-offs (84) –
– (340) (485)
Tax adjustments – 118 60
Environmental remediation
provisions – (132) (160)
Restructuring and reorganizations (146) –
Merger-related expenses – (386)
Litigation provisions – (57)
Dynegy-related
Impairments – equity share (40) (531)
Asset dispositions – equity share – (149)
Other 365 (1,626)
325 (2,306)
$ (53) $ (3,334)
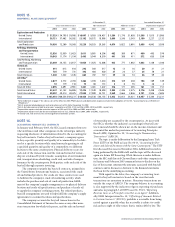
Theaggregateeffectsonincomestatementcategoriesfrom
specialitems,includingChevronTexaco’sproportionateshare
ofspecialitemsrelatedtoequityaffiliates,arereflectedinthe
followingtable.
Notes to the Consolidated Financial Statements
Millionsofdollars,exceptper-shareamounts
SUMMARY OF SIGNIFICANT ACCOUNTING POLICIES – Continued