Chevron 2004 Annual Report Download - page 90
Download and view the complete annual report
Please find page 90 of the 2004 Chevron annual report below. You can navigate through the pages in the report by either clicking on the pages listed below, or by using the keyword search tool below to find specific information within the annual report.-
 1
1 -
2
-
3
-
4
-
5
-
6
-
7
-
8
-
9
-
10
-
11
-
12
-
13
-
14
-
15
-
16
-
17
-
18
-
19
-
20
-
21
-
22
-
23
-
24
-
25
-
26
-
27
-
28
-
29
-
30
-
31
-
32
-
33
-
34
-
35
-
36
-
37
-
38
-
39
-
40
-
41
-
42
-
43
-
44
-
45
-
46
-
47
-
48
-
49
-
50
-
51
-
52
-
53
-
54
-
55
-
56
-
57
-
58
-
59
-
60
-
61
-
62
-
63
-
64
-
65
-
66
-
67
-
68
-
69
-
70
-
71
-
72
-
73
-
74
-
75
-
76
-
77
-
78
-
79
-
 80
80 -
 81
81 -
 82
82 -
 83
83 -
 84
84 -
 85
85 -
 86
86 -
 87
87 -
 88
88 -
 89
89 -
 90
90 -
 91
91 -
 92
92 -
 93
93 -
 94
94 -
 95
95 -
 96
96 -
 97
97 -
 98
98
 |
 |

88 CHEVRONTEXACO CORPORATION 2004 ANNUAL REPORT
Noteworthyamountsinthecategoriesofproved-reserve
changesfor2002through2004intheabovetablearediscussed
below:
Revisions In2002,netrevisionsreducedliquidsvolumes
worldwideby49millionbarrelsforconsolidatedcompanies.
Internationalareasaccountedforanetincreaseof67million
barrels.Thelargestupwardnetrevisioninternationallywas
161millionbarrelsforacontractextensioninAngola.Thelarg-
estnegativenetrevisionwas155millionbarrelsinIndonesia,
mainlyfortheeffectofhigheryear-endpricesonthecalculation
ofreservesassociatedwithcost-oilrecoveryunderaproduction-
sharingcontract.IntheUnitedStates,thetotaldownwardnet
revisionwas116millionbarrelsacrossmanyfieldsineachofthe
geographicsections.The199-million-barrelincreasefortheTCO
affiliatewasassociatedwiththeprojectapprovaltoexpandgas
processingfacilities.
In2003,netrevisionsincreasedreservesby57millionbarrels
forconsolidatedcompanies.WhereasnetU.S.reservechangeswere
minimal,internationalvolumesincreased66millionbarrels.The
largestincreasewasinKazakhstanintheAsia-Pacificareabased
onanupdatedgeologicmodelforonefield.The200-million-barrel
increaseforTCOwasbasedonanupdatedmodelofreservoir
andwellperformance.
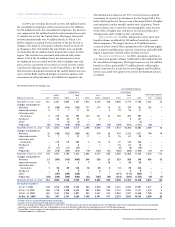
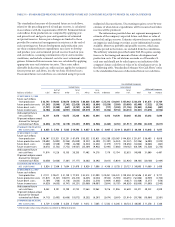
NET PROVED RESERVES OF CRUDE OIL, CONDENSATE AND NATURAL GAS LIQUIDS
Consolidated Companies
United States International
Gulf of Total Asia- Total Affiliated Companies
Millionsofbarrels Calif. Mexico Other U.S. Africa Pacific Indonesia Other Int’l. Total TCO Hamaca
1,140 458 703 2,301 1,544 792 1,114 745 4,195 6,496 1,541 487
Changes attributable to:
Revisions (33) (45) (38) (116) 164 41 (155) 17 67 (49) 199 –
Improved recovery 81 10 8 99 82 – 22 36 140 239 – –
Extensions and discoveries 3 38 7 48 301 81 4 8 394 442 – –
Purchases1 – 2 6 8 – – – – – 8 – –
Sales2– – (3) (3) – – – – – (3) – –
Production (89) (74) (57) (220) (115) (99) (96) (109) (419) (639) (51) (2)
1,102 389 626 2,117 1,976 815 889 697 4,377 6,494 1,689 485
Changes attributable to:
Revisions (4) (5) – (9) (1) 105 (57) 19 66 57 200 –
Improved recovery 38 8 7 53 36 – 54 52 142 195 – –
Extensions and discoveries 2 113 9 124 24 15 3 26 68 192 – –
Purchases1 – 1 – 1 – – – 12 12 13 – –
Sales2 3) (2) (18) (23) – (42) – (1) (43) (66) – –
Production (84) (69) (52) (205) (112) (97) (82) (109) (400) (605) (49) (6)
1,051 435 572 2,058 1,923 796 807 696 4,222 6,280 1,840 479
Changes attributable to:
Revisions
Improved recovery
Extensions and discoveries
Purchases1
Sales2
Production
At Jan. 1, 2002 885 393 609 1,887 923 648 843 517 2,931 4,818 1,007 38
At Dec. 31, 2002 867 335 564 1,766 1,042 642 655 529 2,868 4,634 99 63
At Dec. 31, 2003 832 304 515 1,651 1,059 641 588 522 2,810 4,461 1,304 140
1 Includes reserves acquired through property exchanges.
2 Includes reserves disposed of through property exchanges.
3 Net reserve changes (excluding production) in 2004 consist of 5 million barrels of developed reserves and (209) million barrels of undeveloped reserves for consolidated companies
and 315 million barrels of developed reserves and (111) million barrels of undeveloped reserves for affiliated companies.
4 During 2004, the percentages of undeveloped reserves at December 31, 2003, transferred to developed reserves were 13 percent and 15 percent for consolidated companies and
affiliated companies, respectively.
INFORMATION ON CANADIAN OIL SANDS NET PROVED RESERVES NOT INCLUDED ABOVE:
In addition to conventional liquids and natural gas proved reserves, ChevronTexaco has significant interests in proved oil sands reserves in Canada associated with the Athabasca
project. For internal management purposes, ChevronTexaco views these reserves and their development as an integral part of total upstream operations. However, SEC regula-
tions define these reserves as mining-related and not a part of conventional oil and gas reserves. Net proved oil sands reserves were 167 million barrels as of December 31, 2004.
Production began in late 2002.
The oil sands reserves are not considered in the standardized measure of discounted future net cash flows for conventional oil and gas reserves, which is found on page 91.
Supplemental Information on Oil and Gas Producing Activities – Continued
TABLE V – RESERVE QUANTITY INFORMATION – Continued