Chevron 2004 Annual Report Download - page 87
Download and view the complete annual report
Please find page 87 of the 2004 Chevron annual report below. You can navigate through the pages in the report by either clicking on the pages listed below, or by using the keyword search tool below to find specific information within the annual report.-
 1
1 -
2
-
3
-
4
-
5
-
6
-
7
-
8
-
9
-
10
-
11
-
12
-
13
-
14
-
15
-
16
-
17
-
18
-
19
-
20
-
21
-
22
-
23
-
24
-
25
-
26
-
27
-
28
-
29
-
30
-
31
-
32
-
33
-
34
-
35
-
36
-
37
-
38
-
39
-
40
-
41
-
42
-
43
-
44
-
45
-
46
-
47
-
48
-
49
-
50
-
51
-
52
-
53
-
54
-
55
-
56
-
57
-
58
-
59
-
60
-
61
-
62
-
63
-
64
-
65
-
66
-
67
-
68
-
69
-
70
-
71
-
72
-
73
-
74
-
75
-
76
-
 77
77 -
 78
78 -
 79
79 -
 80
80 -
 81
81 -
 82
82 -
 83
83 -
 84
84 -
 85
85 -
 86
86 -
 87
87 -
 88
88 -
 89
89 -
 90
90 -
 91
91 -
 92
92 -
 93
93 -
 94
94 -
 95
95 -
 96
96 -
 97
97 -
98
 |
 |

CHEVRONTEXACO CORPORATION 2004 ANNUAL REPORT 85
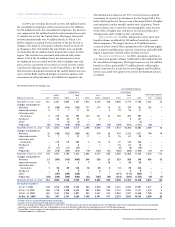
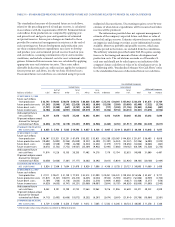
Thecompany’sresultsofoperationsfromoilandgasproduc-
ingactivitiesfortheyears2004,2003and2002areshownin
thefollowingtable.Netincomefromexplorationandproduc-
tionactivitiesasreportedonpage31reflectsincometaxes
computedonaneffectiveratebasis.InaccordancewithFAS69,
incometaxesinTableIIIarebasedonstatutorytaxrates,reflect-
ingallowabledeductionsandtaxcredits.Interestincomeand
expenseareexcludedfromtheresultsreportedinTableIIIand
fromthenetincomeamountsonpage31.
Consolidated Companies
United States International
Gulf of Total Asia- Total Affiliated Companies
Millionsofdollars Calif. Mexico Other U.S. Africa Pacific Indonesia Other Int’l. Total TCO Hamaca
Revenues from net
production
Sales
Transfers
Total
Production expenses
excluding taxes
Taxes other than on
income
Proved producing properties:
depreciation and depletion
Accretion expense2
Exploration expenses
Unproved properties
valuation
Other (expense) income3
Results before
income taxes
Income tax expense
Revenues from net
production
Sales $ 261 $ 2,197 $ 2,049 $ 4,507 $ 1,339 $ 1,442 $ 55 $ 2,556 $ 5,392 $ 9,899 $ 1,116 $ 104
Transfers 2,085 1,740 1,096 4,921 1,835 1,738 1,566 1,356 6,495 11,416 – –
Total 2,346 3,937 3,145 9,428 3,174 3,180 1,621 3,912 11,887 21,315 1,116 104
Production expenses
excluding taxes (631) (578) (750) (1,959) (505) (331) (616) (669) (2,121) (4,080) (117) (20)
Taxes other than on
income (28) (48) (280) (356) (22) (126) (1) (100) (249) (605) (29) –
Proved producing properties:
depreciation and depletion (224) (878) (430) (1,532) (327) (398) (314) (846) (1,885) (3,417) (97) (4)
Accretion expense2 (12) (37) (20) (69) (20) (5) (8) (26) (59) (128) (2) –
Exploration expenses (2) (168) (23) (193) (123) (130) (8) (117) (378) (571) – –
Unproved properties
valuation – (16) (4) (20) (20) (9) – (41) (70) (90) – –
Other (expense) income3 (18) (104) (51) (173) (173) (342) 2 (175) (688) (861) (4) (35)
Results before
income taxes 1,431 2,108 1,587 5,126 1,984 1,839 676 1,938 6,437 11,563 867 45
Income tax expense (528) (777) (585) (1,890) (1,410) (1,158) (289) (831) (3,688) (5,578) (260) –
$ 903 $ 1,331 $ 1,002 $ 3,236 $ 574 $ 681 $ 387 $ 1,107 $ 2,749 $ 5,985 $ 607 $ 45
1 The value of owned production consumed on lease as fuel has been eliminated from revenues and production expenses, and the related volumes have been deducted from net pro-
duction in calculating the unit average sales price and production cost. This has no effect on the results of producing operations.
2 See Note 25 on page 77, FAS 143, “Asset Retirement Obligations.”
3 Includes net sulfur income, foreign currency transaction gains and losses, certain significant impairment write-downs, miscellaneous expenses, etc. Also includes net income from
related oil and gas activities that do not have oil and gas reserves attributed to them (for example, net income from technical and operating service agreements) and items identi-
fied in the MD&A on pages 30 through 32.
4 2003 includes certain reclassifications to conform to 2004 presentation.