Xerox 2005 Annual Report Download - page 96
Download and view the complete annual report
Please find page 96 of the 2005 Xerox annual report below. You can navigate through the pages in the report by either clicking on the pages listed below, or by using the keyword search tool below to find specific information within the annual report.-
 1
1 -
2
-
3
-
4
-
5
-
6
-
7
-
8
-
9
-
10
-
11
-
12
-
13
-
14
-
15
-
16
-
17
-
18
-
19
-
20
-
21
-
22
-
23
-
24
-
25
-
26
-
27
-
28
-
29
-
30
-
31
-
32
-
33
-
34
-
35
-
36
-
37
-
38
-
39
-
40
-
41
-
42
-
43
-
44
-
45
-
46
-
47
-
48
-
49
-
50
-
51
-
52
-
53
-
54
-
55
-
56
-
57
-
58
-
59
-
60
-
61
-
62
-
63
-
64
-
65
-
66
-
67
-
68
-
69
-
70
-
71
-
72
-
73
-
74
-
75
-
76
-
77
-
78
-
79
-
80
-
81
-
82
-
83
-
84
-
85
-
 86
86 -
 87
87 -
 88
88 -
 89
89 -
 90
90 -
 91
91 -
 92
92 -
 93
93 -
 94
94 -
 95
95 -
 96
96 -
 97
97 -
 98
98 -
 99
99 -
 100
100 -
 101
101 -
 102
102 -
 103
103 -
 104
104 -
 105
105 -
 106
106 -
107
-
108
-
109
-
110
-
111
-
112
-
113
-
114
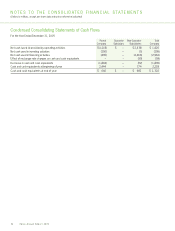
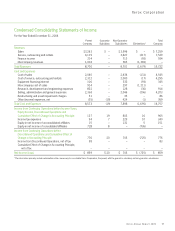
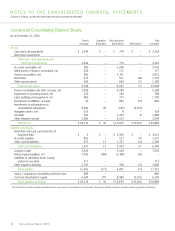
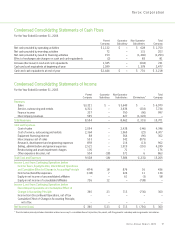
 |
 |

NOTES TO THE CONSOLIDATED FINANCIAL STATEMENTS
(Dollars in millions, except per-share data and unless otherwise indicated)
88
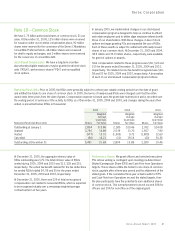
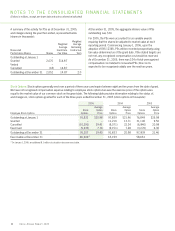
Asummary of the activity for PSs as of December 31, 2005,
and changes during the year then ended, is presented below
(shares in thousands):
Weighted
Weighted Average
Average Remaining
Nonvested Grant Date Contractual
Performance Shares Shares Fair Value Term
Outstanding at January 1 –
Granted 2,070 $14.87
Vested – –
Cancelled (18) 14.87
Outstanding at December 31 2,052 14.87 2.0
At December 31, 2005, the aggregate intrinsic value of PSs
outstanding was $30.
For 2005, the PSs were accounted for as variable awards
requiring that the shares be adjusted to market value at each
reporting period. Commencing January 1, 2006, upon the
adoption of FAS 123(R), PSs will be recorded prospectively using
fair value determined as of the grant date. If the stated targets are
not met, any recognized compensation cost would be reversed.
As of December 31, 2005, there was $24 of total unrecognized
compensation cost related to nonvested PSs; this cost is
expected to be recognized ratably over the next two years.
Xerox Annual Report 2005
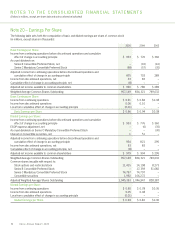
Stock Options: Stock options generally vest over a period of three years and expirebetween eight and ten years from the date of grant.
We have not recognized compensation expense relating to employee stock options because the exercise price of the options was
equal to the market value of our common stock on the grant date. The following table provides information relating to the status of,
and changes in, stock options granted for each of the three years ended December 31, 2005 (stock options in thousands):
2005 2004 2003
Average Average Average
Stock Option Stock Option Stock Option
Employee Stock Options Options Price Options Price Options Price
Outstanding at January 1 91,833 $20.98 97,839 $21.46 76,849 $25.58
Granted – – 11,216 13.71 31,106 9.50
Cancelled (10,291) 39.41 (8,071) 32.24 (6,840) 20.58
Exercised (5,235) 7.74 (9,151) 7.28 (3,276) 6.36
Outstanding at December 31 76,307 19.40 91,833 20.98 97,839 21.46
Exercisable at December 31 66,928(1) 65,199 58,652
(1) On January 1, 2006, an additional 8.1 million stock options became exercisable.