Xerox 2005 Annual Report Download - page 84
Download and view the complete annual report
Please find page 84 of the 2005 Xerox annual report below. You can navigate through the pages in the report by either clicking on the pages listed below, or by using the keyword search tool below to find specific information within the annual report.-
 1
1 -
2
-
3
-
4
-
5
-
6
-
7
-
8
-
9
-
10
-
11
-
12
-
13
-
14
-
15
-
16
-
17
-
18
-
19
-
20
-
21
-
22
-
23
-
24
-
25
-
26
-
27
-
28
-
29
-
30
-
31
-
32
-
33
-
34
-
35
-
36
-
37
-
38
-
39
-
40
-
41
-
42
-
43
-
44
-
45
-
46
-
47
-
48
-
49
-
50
-
51
-
52
-
53
-
54
-
55
-
56
-
57
-
58
-
59
-
60
-
61
-
62
-
63
-
64
-
65
-
66
-
67
-
68
-
69
-
70
-
71
-
72
-
73
-
 74
74 -
 75
75 -
 76
76 -
 77
77 -
 78
78 -
 79
79 -
 80
80 -
 81
81 -
 82
82 -
 83
83 -
 84
84 -
 85
85 -
 86
86 -
 87
87 -
 88
88 -
 89
89 -
 90
90 -
 91
91 -
 92
92 -
 93
93 -
 94
94 -
95
-
96
-
97
-
98
-
99
-
100
-
101
-
102
-
103
-
104
-
105
-
106
-
107
-
108
-
109
-
110
-
111
-
112
-
113
-
114
 |
 |

NOTES TO THE CONSOLIDATED FINANCIAL STATEMENTS
(Dollars in millions, except per-share data and unless otherwise indicated)
76
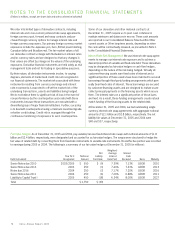
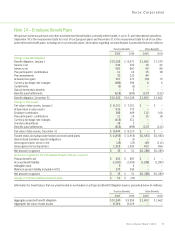
Assumptions
Weighted-average assumptions used Pension Benefits Other benefits
to determine benefit obligations at the
plan measurement dates 2005 2004 2003 2005 2004 2003
Discount rate 5.2% 5.6% 5.8% 5.6% 5.8% 6.0%
Rate of compensation increase 3.9 4.0 3.9 –(1) –(1) –(1)
(1) Rate of compensation increase is not applicable to our other benefits, as compensation levels do not impact earned benefits.
Weighted-average assumptions used Pension Benefits Other Benefits
to determine net periodic benefit cost
for years ended December 31 2006 2005 2004 2003 2006 2005 2004 2003
Discount rate 5.2% 5.6% 5.8% 6.2% 5.6% 5.8% 6.0% 6.5%
Expected return on plan assets 7.8 8.0 8.1 8.3 –(1) –(1) –(1) –(1)
Rate of compensation increase 3.9 4.0 3.9 3.9 –(2) –(2) –(2) –(2)
(1) Expected return on plan assets is not applicable to our other benefits, as these plans are unfunded.
(2) Rate of compensation increase is not applicable to our other benefits, as compensation levels do not impact earned benefits.
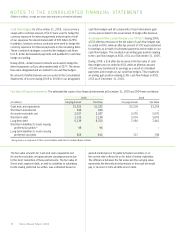
Employee Stock Ownership Plan (“ESOP”) Benefits: In 1989, we
established an ESOP and sold to it 10 million shares of our Series
BConvertible Preferred Stock (the “Convertible Preferred”) for a
purchase price of $785. Each Convertible Preferred share was
convertible into 6 shares of our common stock. The Convertible
Preferred had a $1 par value and a guaranteed minimum value
of $78.25 per share and accrued annual dividends of $6.25 per
share, which were cumulative if earned. In May 2004, all 6.2
million of our Convertible Preferred shares were redeemed for 37
million common shares in accordance with the original conversion
provisions of the Convertible Preferred shares. The redemption
was accounted for through a transfer of $483 from preferred
stock to common stock and additional paid-in-capital. Dividends
werepaid through the redemption date. The redemption had no
impact on net income or diluted earnings per share (“EPS”), as
such shares were previously included in our EPS computation in
accordance with the “if converted” methodology.
Information relating to the ESOP trust for each of the two years
ended December 31, 2004 was as follows (in millions):
2004 2003
Dividends declared on Convertible
Preferred Stock $15 $ 41
Cash contribution to the ESOP – 14
Compensation expense – 8
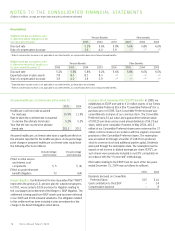
Assumed healthcare cost trend rates at December 31
2005 2004
Healthcare cost trend rate assumed
for next year 10.9% 11.9%
Rate to which the cost trend rate is assumed
to decline (the ultimate trend rate) 5.2% 5.2%
Year that the rate reaches the ultimate
trend rate 2011 2011
Assumed healthcarecost trend rates have a significant effect on
the amounts reported for the healthcare plans. A one-percentage
point change in assumed healthcarecost trend rates would have
the following effects (in millions):
One-percentage One-percentage
point increase point decrease
Effect on total service
and interest cost
components $ 5 $ (4)
Effect on post-retirement
benefit obligation 73 (64)
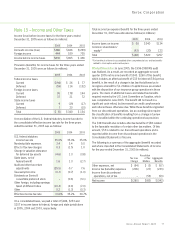
Berger Litigation: Our Retirement Income Guarantee Plan (“RIGP”)
represents the primary U.S. pension plan for salaried employees.
In 2003, we recorded a $239 provision for litigation relating to
the court-approved settlement of the Berger v. RIGP litigation. The
settlement is being paid from RIGP assets and has been reflected
in our 2005 and 2004 actuarial valuations. The obligation related
to this settlement has been included in plan amendments in the
change in the benefit obligation noted above.
Xerox Annual Report 2005