Xerox 2005 Annual Report Download - page 100
Download and view the complete annual report
Please find page 100 of the 2005 Xerox annual report below. You can navigate through the pages in the report by either clicking on the pages listed below, or by using the keyword search tool below to find specific information within the annual report.-
 1
1 -
2
-
3
-
4
-
5
-
6
-
7
-
8
-
9
-
10
-
11
-
12
-
13
-
14
-
15
-
16
-
17
-
18
-
19
-
20
-
21
-
22
-
23
-
24
-
25
-
26
-
27
-
28
-
29
-
30
-
31
-
32
-
33
-
34
-
35
-
36
-
37
-
38
-
39
-
40
-
41
-
42
-
43
-
44
-
45
-
46
-
47
-
48
-
49
-
50
-
51
-
52
-
53
-
54
-
55
-
56
-
57
-
58
-
59
-
60
-
61
-
62
-
63
-
64
-
65
-
66
-
67
-
68
-
69
-
70
-
71
-
72
-
73
-
74
-
75
-
76
-
77
-
78
-
79
-
80
-
81
-
82
-
83
-
84
-
85
-
86
-
87
-
88
-
89
-
 90
90 -
 91
91 -
 92
92 -
 93
93 -
 94
94 -
 95
95 -
 96
96 -
 97
97 -
 98
98 -
 99
99 -
 100
100 -
 101
101 -
 102
102 -
 103
103 -
 104
104 -
 105
105 -
 106
106 -
 107
107 -
 108
108 -
 109
109 -
 110
110 -
111
-
112
-
113
-
114
 |
 |

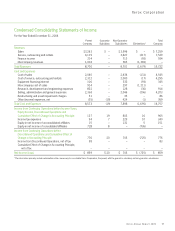
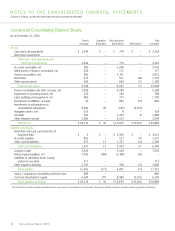
NOTES TO THE CONSOLIDATED FINANCIAL STATEMENTS
(Dollars in millions, except per-share data and unless otherwise indicated)
92
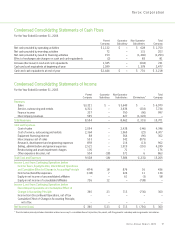
Condensed Consolidating Statements of Income
For the Year Ended December 31, 2005
Parent Guarantor Non-Guarantor Total
Company Subsidiary Subsidiaries Eliminations* Company
Revenues
Sales $3,292 $ – $ 4,108 $ – $ 7,400
Service, outsourcing and rentals 4,006 – 3,629 (209) 7,426
Finance income 313 – 679 (117) 875
Intercompany revenues 1,178 – 319 (1,497) –
Total Revenues 8,789 – 8,735 (1,823) 15,701
Costs and Expenses
Cost of sales 2,034 – 2,823 (162) 4,695
Cost of service, outsourcing and rentals 2,253 – 1,956 (2) 4,207
Equipment financing interest 152 – 291 (117) 326
Intercompany cost of sales 1,044 – 252 (1,296) –
Research, development and engineering expenses 865 – 117 (39) 943
Selling, administrative and general expenses 2,289 – 2,028 (207) 4,110
Restructuring and asset impairment charges 167 – 201 (2) 366
Other (income) expenses, net (170) (23) 420 (3) 224
Total Costs and Expenses 8,634 (23) 8,088 (1,828) 14,871
Income from Continuing Operations before Income Taxes,
Equity Income, Discontinued Operations and
Cumulative Effect of Change in Accounting Principle 155 23 647 5 830
Income tax (benefits) expenses (184) 9 163 7 (5)
Equity in net income of unconsolidated affiliates 5 – 99 (6) 98
Equity in net income of consolidated affiliates 584 8 2 (594) –
Income from Continuing Operations before
Discontinued Operations and Cumulative Effect
of Change in Accounting Principle 928 22 585 (602) 933
Income from Discontinued Operations, net of tax 53 – – – 53
Cumulative Effect of Change in Accounting Principle,
net of tax (3) – (5) – (8)
Net Income (Loss) $ 978 $ 22 $ 580 $ (602) $ 978
*The information primarily includes elimination entries necessary to consolidate Xerox Corporation, the parent, with the guarantor subsidiary and non-guarantor subsidiaries.
Xerox Annual Report 2005