Xerox 2005 Annual Report Download - page 48
Download and view the complete annual report
Please find page 48 of the 2005 Xerox annual report below. You can navigate through the pages in the report by either clicking on the pages listed below, or by using the keyword search tool below to find specific information within the annual report.-
 1
1 -
2
-
3
-
4
-
5
-
6
-
7
-
8
-
9
-
10
-
11
-
12
-
13
-
14
-
15
-
16
-
17
-
18
-
19
-
20
-
21
-
22
-
23
-
24
-
25
-
26
-
27
-
28
-
29
-
30
-
31
-
32
-
33
-
34
-
35
-
36
-
37
-
 38
38 -
 39
39 -
 40
40 -
 41
41 -
 42
42 -
 43
43 -
 44
44 -
 45
45 -
 46
46 -
 47
47 -
 48
48 -
 49
49 -
 50
50 -
 51
51 -
 52
52 -
 53
53 -
 54
54 -
 55
55 -
 56
56 -
 57
57 -
 58
58 -
59
-
60
-
61
-
62
-
63
-
64
-
65
-
66
-
67
-
68
-
69
-
70
-
71
-
72
-
73
-
74
-
75
-
76
-
77
-
78
-
79
-
80
-
81
-
82
-
83
-
84
-
85
-
86
-
87
-
88
-
89
-
90
-
91
-
92
-
93
-
94
-
95
-
96
-
97
-
98
-
99
-
100
-
101
-
102
-
103
-
104
-
105
-
106
-
107
-
108
-
109
-
110
-
111
-
112
-
113
-
114
 |
 |

MANAGEMENT’S DISCUSSION AND ANALYSIS OF
RESULTS OF OPERATIONS AND FINANCIAL CONDITION
40
•Partially offsetting these items were lower tax payments of $96
million due to refunds from audit and other tax settlements, as
well as the timing of payments associated with restructuring.
•Partially offsetting lower pension contributions of $21 million.
For the year ended December 31, 2004, net cash provided by
operating activities decreased $129 million from 2003, primarily
as a result of the following:
•Lower finance receivable reductions of $159 million reflecting
the increase in equipment sale revenue in 2004.
•Higher cash usage related to inventory of $100 million to
support new products.
•Increased tax payments of $46 million due to increased income.
•Lower cash generation from the early termination of interest
rate swaps of $62 million.
•Lower pension plan contributions of $263 million, partially
offsetting the above cash outflows.
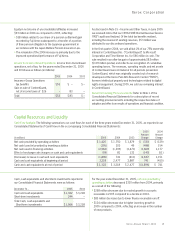
We expect 2006 operating cash flows to be at the high end of the
range of $1.2 billion to $1.5 billion, as compared to $1.4 billion in
2005. This expectation reflects cash generation from a decrease
in finance receivables that offsets cash usage from an increase
in equipment on operating leases, resulting in a neutral impact on
net operating cash flow.Since finance receivables and on-lease
equipment are expected to be leveraged at a 7:1 debt-to-equity
ratio, if these items collectively use or provide cash the overall
impact on our total cash flows should be minimal, since our debt
should also increase or decrease as appropriate to maintain our
current leverage.
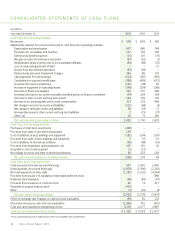
For the year ended December 31, 2005, net cash from investing
activities decreased $498 million from 2004 primarily as a result
of the following:
•$247 million from the net purchases of short-term investments
which were intended to increase our return on available cash.
•Decrease of $143 million due to a lower net reduction of escrow
and other restricted investments due to the 2004 renegotiation of
certain secured borrowing arrangements and scheduled releases
from an escrow account of supporting interest payments on our
prior liability to a trust issuing preferred securities.
•Decrease of $86 million due to lower proceeds from divestitures
and investments, net, reflecting:
–2005 proceeds of $105 million primarily consisting
of $96 million from the sale of our equity interest in
Integic Corporation.
–2004 proceeds of $191 million primarily consisting of
$66 million from the ContentGuardsale, $79 million from
the ScanSoft sale and $36 million from a preferred
stock investment.
•Decrease of $48 million due to lower proceeds from the sale
of excess land and buildings.
•Partially offsetting these items was a $15 million decrease in
capital and internal use software expenditures.
We expect 2006 capital expenditures including internal use
software to approximate $250 million.
For the year ended December 31, 2004, net cash from investing
activities increased $154 million from 2003, primarily as a result
of the following:
•An increase of $156 million in proceeds from the sale of busi-
nesses and investments, consisting of the $191 million referred
to above, as offset by $35 million of proceeds from the 2003
divestitures of investments in South Africa, France and Germany.
•An increase of $43 million of proceeds from the sale of certain
excess land and buildings.
•Partially offsetting these items was a $12 million decrease due
to the acquisition of an additional interest in Xerox India in 2004,
and a $31 million decrease due to a lower net reduction of
escrow and other restricted investments. 2003 investing cash
flows included $235 million related to our former reinsurance
obligations with our discontinued operations.
For the year ended December 31, 2005, net cash used in
financing activities increased $1.7 billion from 2004, primarily
as a result of the following:
•A$1.5 billion reduction in proceeds from new secured
financings, reflecting a rebalancing of our secured and
unsecured debt portfolio.
•$433 million cash usage for the acquisition of common stock
under the authorized October 2005 share repurchase program.
•Apartially offsetting $235 million decrease in net payments on
term and other debt reflecting lower debt maturity obligations.
For the year ended December 31, 2004, net cash used in
financing activities decreased $1.2 billion from 2003, primarily
as a result of the following:
•A$2.6 billion decrease in net payments of term and other debt.
•$889 million in proceeds received on the issuance of mandatory
redeemable preferred stock in 2003.
•Apartially offsetting decrease of $404 million in proceeds from
the issuance of common stock and a decrease of $114 million
in net proceeds from secured financing.
Xerox Annual Report 2005