Xerox 2005 Annual Report Download - page 34
Download and view the complete annual report
Please find page 34 of the 2005 Xerox annual report below. You can navigate through the pages in the report by either clicking on the pages listed below, or by using the keyword search tool below to find specific information within the annual report.-
 1
1 -
2
-
3
-
4
-
5
-
6
-
7
-
8
-
9
-
10
-
11
-
12
-
13
-
14
-
15
-
16
-
17
-
18
-
19
-
20
-
21
-
22
-
23
-
 24
24 -
 25
25 -
 26
26 -
 27
27 -
 28
28 -
 29
29 -
 30
30 -
 31
31 -
 32
32 -
 33
33 -
 34
34 -
 35
35 -
 36
36 -
 37
37 -
 38
38 -
 39
39 -
 40
40 -
 41
41 -
 42
42 -
 43
43 -
 44
44 -
45
-
46
-
47
-
48
-
49
-
50
-
51
-
52
-
53
-
54
-
55
-
56
-
57
-
58
-
59
-
60
-
61
-
62
-
63
-
64
-
65
-
66
-
67
-
68
-
69
-
70
-
71
-
72
-
73
-
74
-
75
-
76
-
77
-
78
-
79
-
80
-
81
-
82
-
83
-
84
-
85
-
86
-
87
-
88
-
89
-
90
-
91
-
92
-
93
-
94
-
95
-
96
-
97
-
98
-
99
-
100
-
101
-
102
-
103
-
104
-
105
-
106
-
107
-
108
-
109
-
110
-
111
-
112
-
113
-
114
 |
 |

MANAGEMENT’S DISCUSSION AND ANALYSIS OF
RESULTS OF OPERATIONS AND FINANCIAL CONDITION
26
The following Management’s Discussion and Analysis (“MD&A”) is
intended to help the reader understand the results of operations
and financial condition of Xerox Corporation. MD&A is provided
as a supplement to, and should be read in conjunction with, our
consolidated financial statements and the accompanying notes.
Throughout this document, references to “we,” “our,” the “Company”
and “Xerox” refer to Xerox Corporation and its subsidiaries.
References to “Xerox Corporation” refer to the stand-alone parent
company and do not include its subsidiaries.
Executive Overview
We are a technology and services enterprise and a leader in the
global document market, developing, manufacturing, marketing,
servicing and financing the industry’s broadest portfolio of docu-
ment equipment, solutions and services. Our industry is undergoing
aseries of transformations from older technology light-lens
devices to digital systems, from black and white to color, and
from paper documents to an increased reliance on electronic
documents. Webelieve we arewell positioned as these trans-
formations play to our strengths and represent opportunities for
futuregrowth, since our research and development investments
have been focused on digital and color offerings.
Weoperate in competitive markets and our customers demand
improved solutions, such as the ability to print offset-quality color
documents on demand; improved product functionality,such
as the ability to print, copy,fax and scan from a single device;
and lower prices for the same functionality. Customers are also
increasingly demanding document services such as consulting
and assessments, managed services, imaging and hosting, and
document-intensive business process improvements.
We deliver advanced technology through focused investment
in research and development and offset lower prices through
continuous improvement of our cost base. The majority of
our revenue is recurring revenue (supplies, service, paper, out-
sourcing and rentals), which we collectively refer to as post sale
revenue. Post sale revenue is heavily dependent on the amount
of equipment installed at customer locations and the utilization
of those devices. As such, our critical success factors include
hardwareinstallations, which stabilize and grow our installed base
of equipment at customer locations, page volume growth and
higher revenue per page. Connected multifunction devices, new
services and solutions arekey drivers to increase equipment
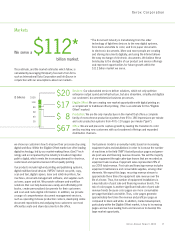
usage. The transition to color is the primary driver to improve
revenue per page, as color documents typically require signifi-
cantly moretoner coverage per page than traditional black and
white printing. Revenue per color page is approximately five
times higher than revenue per black and white page.
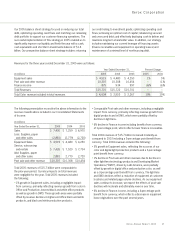
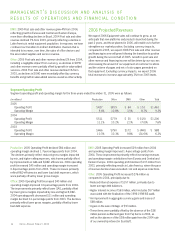
Financial Overview
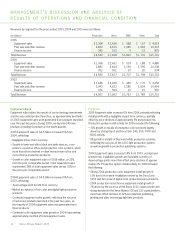
In 2005, we expanded earnings and made significant progress
in positioning ourselves for revenue growth while significantly
improving our overall financial condition and liquidity. Our
continued focus on investment in the growing areas of digital
production and office systems, particularly with respect to color
products, contributed to equipment sales growth, as the majority
of our equipment sales were generated from products launched
in the last two years. Total revenue was comparable to the prior
year, as modest equipment sales growth was offset by declines
in finance income. Post sale and other was comparable to
the prior year. Color revenue was up 19% over the prior year,
reflecting our investments in this market.
We maintained our focus on cost management throughout 2005.
While 2005 gross margins were slightly below 2004, we continued
to more than offset lower prices with productivity improvements.
Gross margins were impacted by a change in overall product
mix reflecting a higher proportion of sales of products with lower
gross margins. Wereduced selling, administrative and general
(“SAG”) expenses as administrative and general expense effi-
ciencies, and reductions in bad debt expense morethan offset
increased selling expenses. Wecontinued to invest in research
and development, prioritizing our investments in the faster-
growing areas of the market. In addition, we reduced interest
expense by decreasing debt by over $2.8 billion during the year.
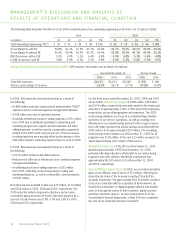
Tounderstand the trends in the business, we believe that it is
helpful to analyze the impact of changes in the translation of
foreign currencies into U.S. dollars on revenue and expense growth.
Werefer to this analysis as “currency impact” or “the impact from
currency.” Revenues and expenses from our Developing Markets
Operations are analyzed at actual exchange rates for all periods
presented, since these countries generally have volatile currency
and inflationary environments, and our operations in these countries
have historically implemented pricing actions to recover the impact
of inflation and devaluation. We do not hedge the translation effect
of revenues or expenses denominated in currencies where the local
currency is the functional currency.
Asubstantial portion of our consolidated revenue is derived
from operations outside of the United States where the U.S. dollar
is not the functional currency. When compared with the average
of the major European currencies on a revenue-weighted basis,
the U.S. dollar was largely unchanged in 2005, 10% weaker in
2004 and 17% weaker in 2003. As a result, the foreign currency
translation impact on revenue was negligible in 2005. For 2004
and 2003, foreign currency translation had a 3-percentage point
and 5-percentage point favorable impact, respectively.
Xerox Annual Report 2005