Xerox 2005 Annual Report Download - page 105
Download and view the complete annual report
Please find page 105 of the 2005 Xerox annual report below. You can navigate through the pages in the report by either clicking on the pages listed below, or by using the keyword search tool below to find specific information within the annual report.-
 1
1 -
2
-
3
-
4
-
5
-
6
-
7
-
8
-
9
-
10
-
11
-
12
-
13
-
14
-
15
-
16
-
17
-
18
-
19
-
20
-
21
-
22
-
23
-
24
-
25
-
26
-
27
-
28
-
29
-
30
-
31
-
32
-
33
-
34
-
35
-
36
-
37
-
38
-
39
-
40
-
41
-
42
-
43
-
44
-
45
-
46
-
47
-
48
-
49
-
50
-
51
-
52
-
53
-
54
-
55
-
56
-
57
-
58
-
59
-
60
-
61
-
62
-
63
-
64
-
65
-
66
-
67
-
68
-
69
-
70
-
71
-
72
-
73
-
74
-
75
-
76
-
77
-
78
-
79
-
80
-
81
-
82
-
83
-
84
-
85
-
86
-
87
-
88
-
89
-
90
-
91
-
92
-
93
-
94
-
 95
95 -
 96
96 -
 97
97 -
 98
98 -
 99
99 -
 100
100 -
 101
101 -
 102
102 -
 103
103 -
 104
104 -
 105
105 -
 106
106 -
 107
107 -
 108
108 -
 109
109 -
 110
110 -
 111
111 -
 112
112 -
 113
113 -
 114
114
 |
 |

Xerox Corporation
97
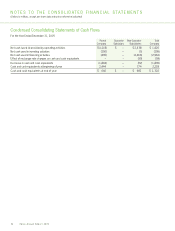
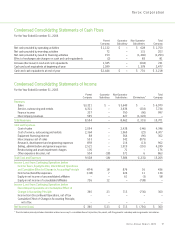
Condensed Consolidating Statements of Cash Flows
For the Year Ended December 31, 2004
Parent Guarantor Non-Guarantor Total
Company Subsidiary Subsidiaries Company
Net cash provided by operating activities $ 1,122 $ – $ 628 $ 1,750
Net cash provided by investing activities 72 – 131 203
Net cash provided by (used in) financing activities 153 – (1,446) (1,293)
Effect of exchange rate changes on cash and cash equivalents (2) – 83 81
Increase (decrease) in cash and cash equivalents 1,345 – (604) 741
Cash and cash equivalents at beginning of year 1,099 – 1,378 2,477
Cash and cash equivalents at end of year $2,444 $ – $ 774 $ 3,218
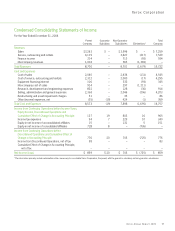
Condensed Consolidating Statements of Income
For the Year Ended December 31, 2003
Parent Guarantor Non-Guarantor Total
Company Subsidiary Subsidiaries Eliminations* Company
Revenues
Sales $3,321 $ – $ 3,649 $ – $ 6,970
Service, outsourcing and rentals 4,301 – 3,636 (203) 7,734
Finance income 337 – 750 (90) 997
Intercompany revenues 595 – 427 (1,022) –
Total Revenues 8,554 – 8,462 (1,315) 15,701
Cost and Expenses
Cost of sales 2,054 – 2,438 (146) 4,346
Cost of service, outsourcing and rentals 2,364 – 1,965 (22) 4,307
Equipment financing interest 88 – 364 (90) 362
Intercompany cost of sales 533 – 342 (875) –
Research, development and engineering expenses 859 – 116 (13) 962
Selling, administrative and general expenses 2,521 – 1,919 (191) 4,249
Restructuring and asset impairment charges 105 – 71 – 176
Other expenses (income), net 504 (18) 371 6 863
Total Cost and Expenses 9,028 (18) 7,586 (1,331) 15,265
Income (Loss) from Continuing Operations before
Income Taxes, Equity Income, Discontinued Operations
and Cumulative Effect of Change in Accounting Principle (474) 18 876 16 436
Income tax (benefits) expenses (108) 7 224 11 134
Equity in net income of unconsolidated affiliates – – 61 (3) 58
Equity in net income of consolidated affiliates 726 12 – (738) –
Income (Loss) from Continuing Operations before
Discontinued Operations and Cumulative Effect of
Change in Accounting Principle 360 23 713 (736) 360
Income from Discontinued Operations, net of tax – – – – –
Cumulative Effect of Change in Accounting Principle,
net of tax – – – – –
Net Income (Loss) $360 $ 23 $ 713 $ (736) $ 360
*The information primarily includes elimination entries necessary to consolidate Xerox Corporation, the parent, with the guarantor subsidiary and non-guarantor subsidiaries.
Xerox Annual Report 2005