Xerox 2005 Annual Report Download - page 83
Download and view the complete annual report
Please find page 83 of the 2005 Xerox annual report below. You can navigate through the pages in the report by either clicking on the pages listed below, or by using the keyword search tool below to find specific information within the annual report.-
 1
1 -
2
-
3
-
4
-
5
-
6
-
7
-
8
-
9
-
10
-
11
-
12
-
13
-
14
-
15
-
16
-
17
-
18
-
19
-
20
-
21
-
22
-
23
-
24
-
25
-
26
-
27
-
28
-
29
-
30
-
31
-
32
-
33
-
34
-
35
-
36
-
37
-
38
-
39
-
40
-
41
-
42
-
43
-
44
-
45
-
46
-
47
-
48
-
49
-
50
-
51
-
52
-
53
-
54
-
55
-
56
-
57
-
58
-
59
-
60
-
61
-
62
-
63
-
64
-
65
-
66
-
67
-
68
-
69
-
70
-
71
-
72
-
 73
73 -
 74
74 -
 75
75 -
 76
76 -
 77
77 -
 78
78 -
 79
79 -
 80
80 -
 81
81 -
 82
82 -
 83
83 -
 84
84 -
 85
85 -
 86
86 -
 87
87 -
 88
88 -
 89
89 -
 90
90 -
 91
91 -
 92
92 -
 93
93 -
94
-
95
-
96
-
97
-
98
-
99
-
100
-
101
-
102
-
103
-
104
-
105
-
106
-
107
-
108
-
109
-
110
-
111
-
112
-
113
-
114
 |
 |

Xerox Corporation
75
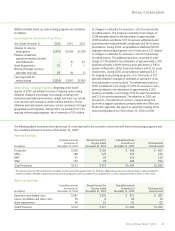
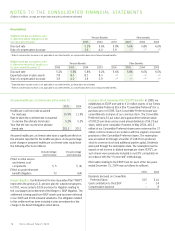
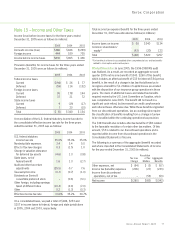
Plan Assets
Current Allocation and Investment Targets: As of the 2005 and 2004 measurement dates, the global pension plan assets were
$8.4 billion and $8.1 billion, respectively. These assets were invested among several asset classes. The amount and percentage of
assets invested in each asset class as of each of these dates is shown below:
Percentage of
Asset Value Total Assets
(in millions) 2005 2004 2005 2004
Asset Category
Equity securities(1) $ 4,830 $ 4,753 57% 58%
Debt securities(1) 2,723 2,592 32 32
Real estate 504 464 6 6
Other 387 301 5 4
Total $8,444 $8,110 100% 100%
(1) None of the investments includes debt or equity securities of Xerox Corporation.
Xerox Annual Report 2005
Investment Strategy: The target asset allocations for our
worldwide plans for 2005 were 54% invested in equities, 39%
invested in fixed income, 6% invested in real estate and 1%
invested in Other. The target asset allocations for our worldwide
plans for 2004 were 59% invested in equities, 34% invested in
fixed income, 6% invested in real estate and 1% invested in Other.
The pension assets outside of the U.S. as of the 2005 and 2004
measurement dates were $4.3 billion and $4.1 billion, respectively.
The target asset allocations for the U.S. pension plan include
64% invested in equities, 30% in fixed income, 5% in real estate
and 1% in other investments. Cash investments are sufficient
to handle expected cash requirements for benefit payments
and will vary throughout the year.The expected long-term rate
of return on the U.S. pension assets is 8.75%.
We employ a total return investment approach whereby a mix
of equities and fixed-income investments are used to maximize
the long-term return of plan assets for a prudent level of risk.
The intent of this strategy is to minimize plan expenses by
exceeding the interest growth in long-term plan liabilities. Risk
tolerance is established through careful consideration of plan
liabilities, plan funded status, and corporate financial condition.
This consideration involves the use of long-term measures that
address both return and risk. The investment portfolio contains
adiversified blend of equity and fixed-income investments.
Furthermore, equity investments are diversified across U.S and
non-U.S. stocks as well as growth, value, and small and large
capitalizations. Other assets such as real estate, private equity
and hedge funds are used to improve portfolio diversification.
Derivatives may be used to hedge market exposurein an efficient
and timely manner; however,derivatives may not be used to
leverage the portfolio beyond the market value of the underlying
investments. Investment risks and returns aremeasured and
monitored on an ongoing basis through annual liability
measurements and quarterly investment portfolio reviews.
Expected Long-Term Rate of Return: We employ a “building block”
approach in determining the long-term rate of return for plan assets.
Historical markets are studied and long-term relationships between
equities and fixed income areassessed. Current market factors
such as inflation and interest rates are evaluated before long-term
capital market assumptions are determined. The long-term portfolio
return is established giving consideration to investment diversifica-
tion and rebalancing. Peer data and historical returns are reviewed
periodically to assess reasonableness and appropriateness.
Contributions: We expect to contribute $106 to our worldwide
pension plans and $130 to our other post-retirement benefit plans
in 2006. The 2006 expected pension plan contributions do not
include any planned contribution for the domestic tax-qualified
plans because thereare no required contributions to these plans
for the 2006 fiscal year. However, once the January 1, 2006
actuarial valuations and projected results as of the end of the
2006 measurement year are available, the desirability of addi-
tional contributions will be assessed. Based on these results,
we may voluntarily decide to contribute to these plans, even
though no contribution is required. In prior years, after making
this assessment, we decided to contribute $230 and $210 in
April 2005 and April 2004, respectively,to our domestic tax-
qualified plans in order to make them 100% funded on a current
liability basis under the ERISA funding rules.
Estimated FutureBenefit Payments: The following benefit
payments, which reflect expected futureservice, as appropriate,
are expected to be paid (in millions):
Pension Benefits Other Benefits
2006 $ 731 $ 130
2007 580 133
2008 531 135
2009 591 134
2010 667 129
Years 2011-2015 3,437 640